| Start Page |
|
 |
| Start Page |
|
|
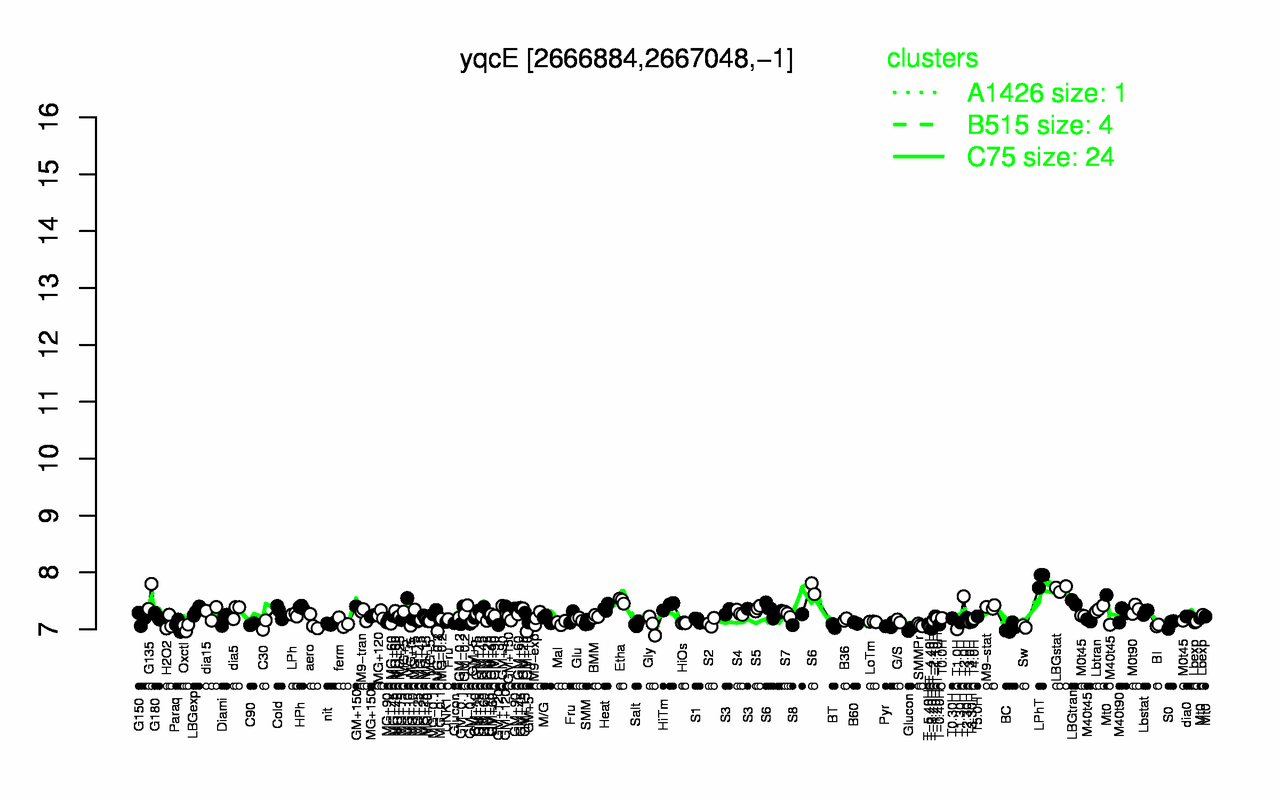
| LPhT | LBGstat | T2.0H | G135 | Etha | LBGtran | S6 | HiTm | M9-stat | HPh |
| 7.88 | 7.72 | 7.58 | 7.58 | 7.5 | 7.47 | 7.41 | 7.41 | 7.39 | 7.39 |
| T1.0H | T-3.40H | BC | T-4.40H | Glucon | Oxctl | Sw | BT | MG+t5 | BI |
| 7 | 7.01 | 7.02 | 7.03 | 7.04 | 7.04 | 7.05 | 7.06 | 7.06 | 7.07 |