| Start Page |
|
 |
| Start Page |
|
|
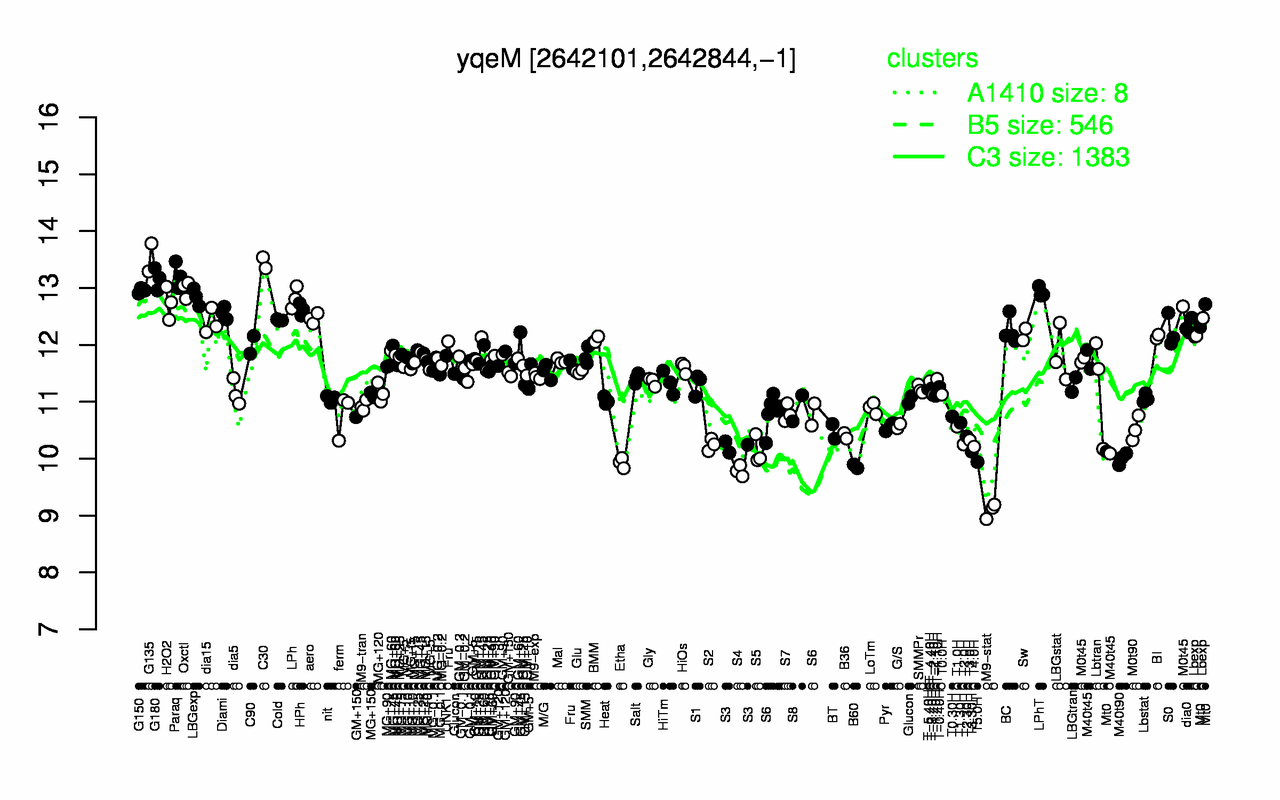
| G135 | C30 | Paraq | G180 | Oxctl | G150 | LPhT | LBGexp | LPh | H2O2 |
| 13.5 | 13.4 | 13.2 | 13.2 | 13 | 13 | 12.9 | 12.8 | 12.8 | 12.7 |
| M9-stat | S4 | B60 | Etha | T5.0H | M40t90 | T3.30H | S5 | T4.0H | S3 |
| 9.09 | 9.79 | 9.87 | 9.93 | 9.94 | 10 | 10.1 | 10.1 | 10.2 | 10.2 |