| Start Page |
|
 |
| Start Page |
|
|
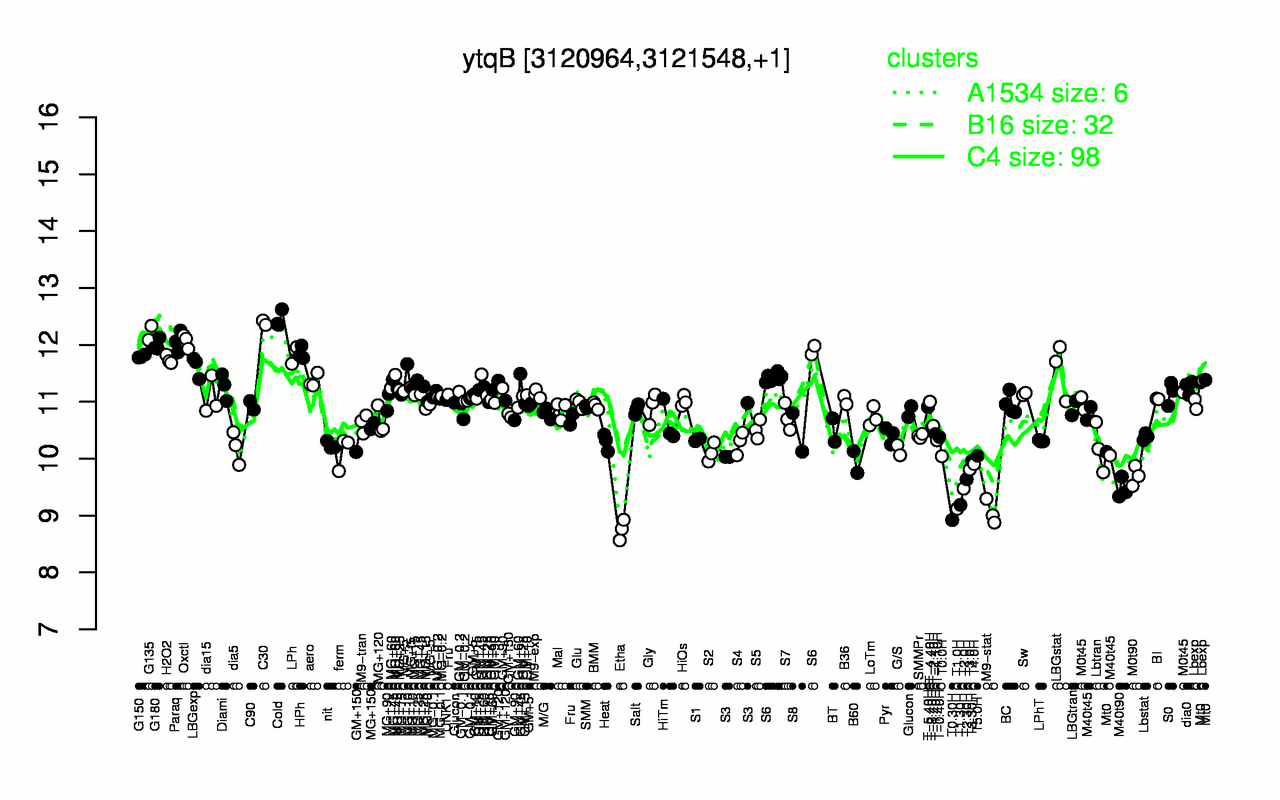
| Cold | C30 | G135 | Oxctl | Paraq | G180 | HPh | LPh | G150 | H2O2 |
| 12.4 | 12.4 | 12.2 | 12.1 | 12.1 | 12 | 11.9 | 11.8 | 11.8 | 11.7 |
| Etha | T0.30H | M9-stat | T1.0H | T1.30H | T2.0H | M40t90 | T2.30H | M0t90 | T3.0H |
| 8.75 | 8.92 | 9.06 | 9.12 | 9.19 | 9.47 | 9.48 | 9.64 | 9.7 | 9.81 |