| Start Page |
|
 |
| Start Page |
|
|
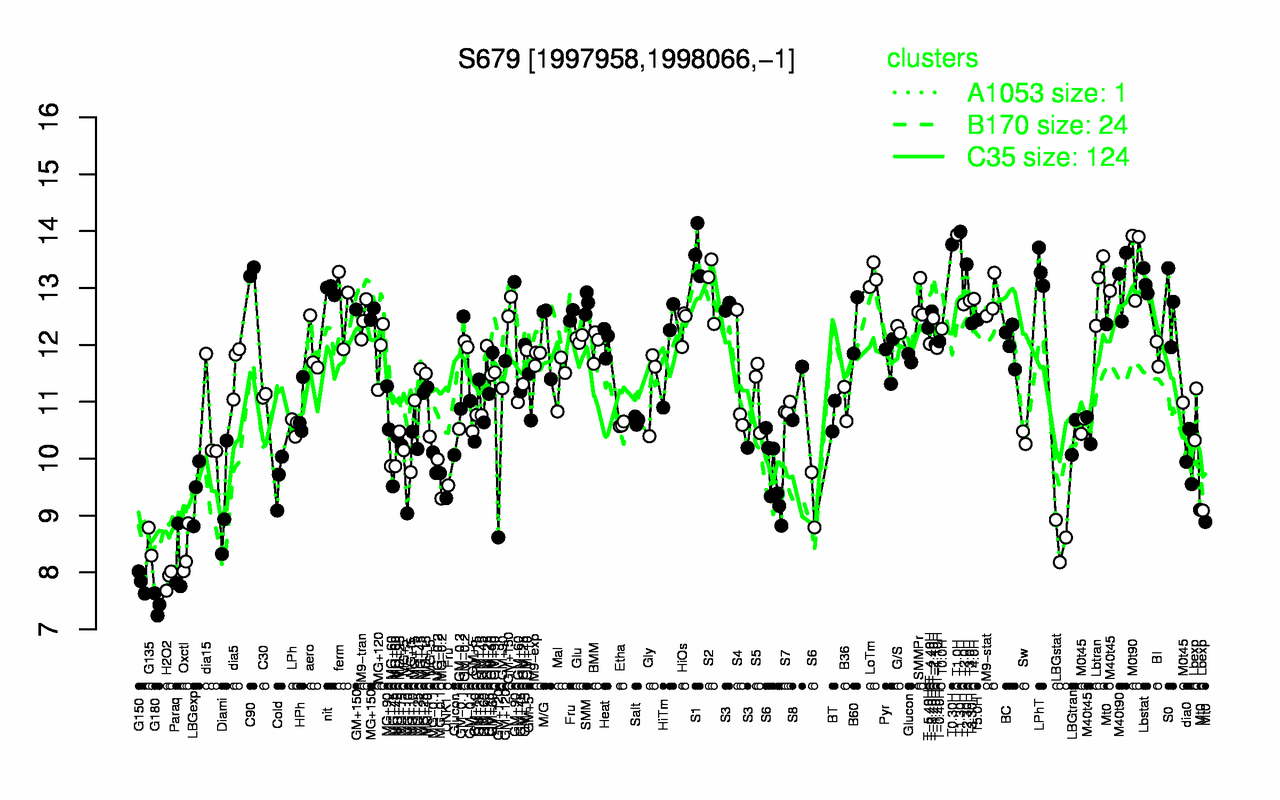
| T1.30H | T1.0H | T0.30H | S1 | M0t90 | T2.30H | LPhT | C90 | LoTm | Lbstat |
| 14 | 13.9 | 13.8 | 13.6 | 13.5 | 13.4 | 13.3 | 13.3 | 13.2 | 13.1 |
| G180 | G150 | H2O2 | Paraq | Oxctl | G135 | LBGstat | Diami | UNK1 | LBGexp |
| 7.44 | 7.83 | 7.88 | 8.15 | 8.36 | 8.54 | 8.57 | 9.19 | 9.31 | 9.42 |