| Supplementary data of the associated publication Start Page |
|
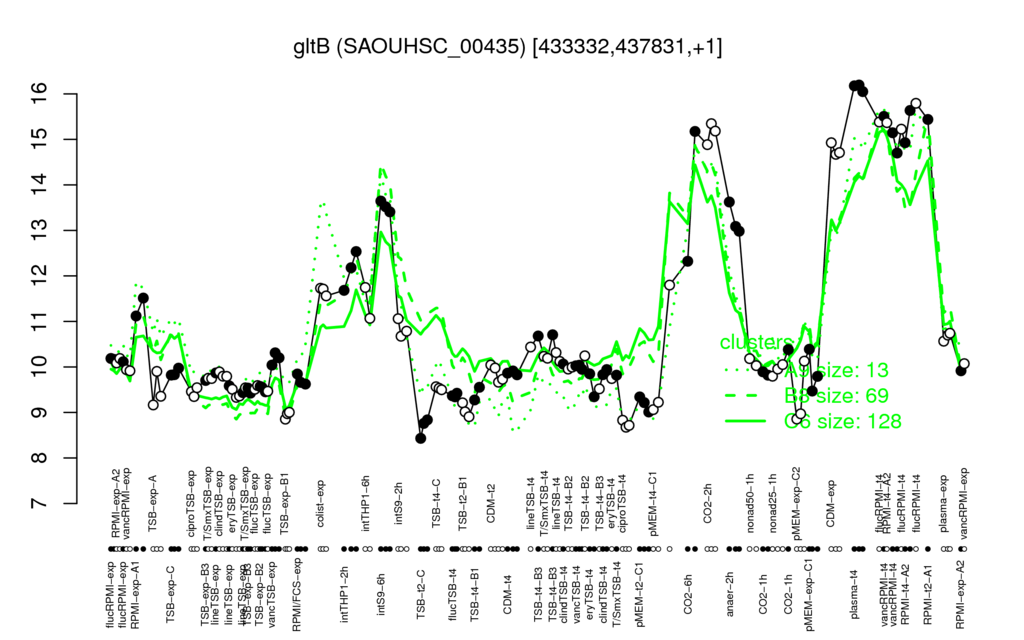
| plasma-t4 | flucRPMI-t4 | RPMI-t2-A1 | RPMI-t4-A2 | CO2-2h |
| 16.1 | 15.5 | 15.4 | 15.3 | 15.1 |
| TSB-t2-C | ciproTSB-t4 | TSB-exp-B1 | TSB-t2-B1 | pMEM-t2-C1 |
| 8.68 | 8.74 | 8.94 | 9.04 | 9.19 |
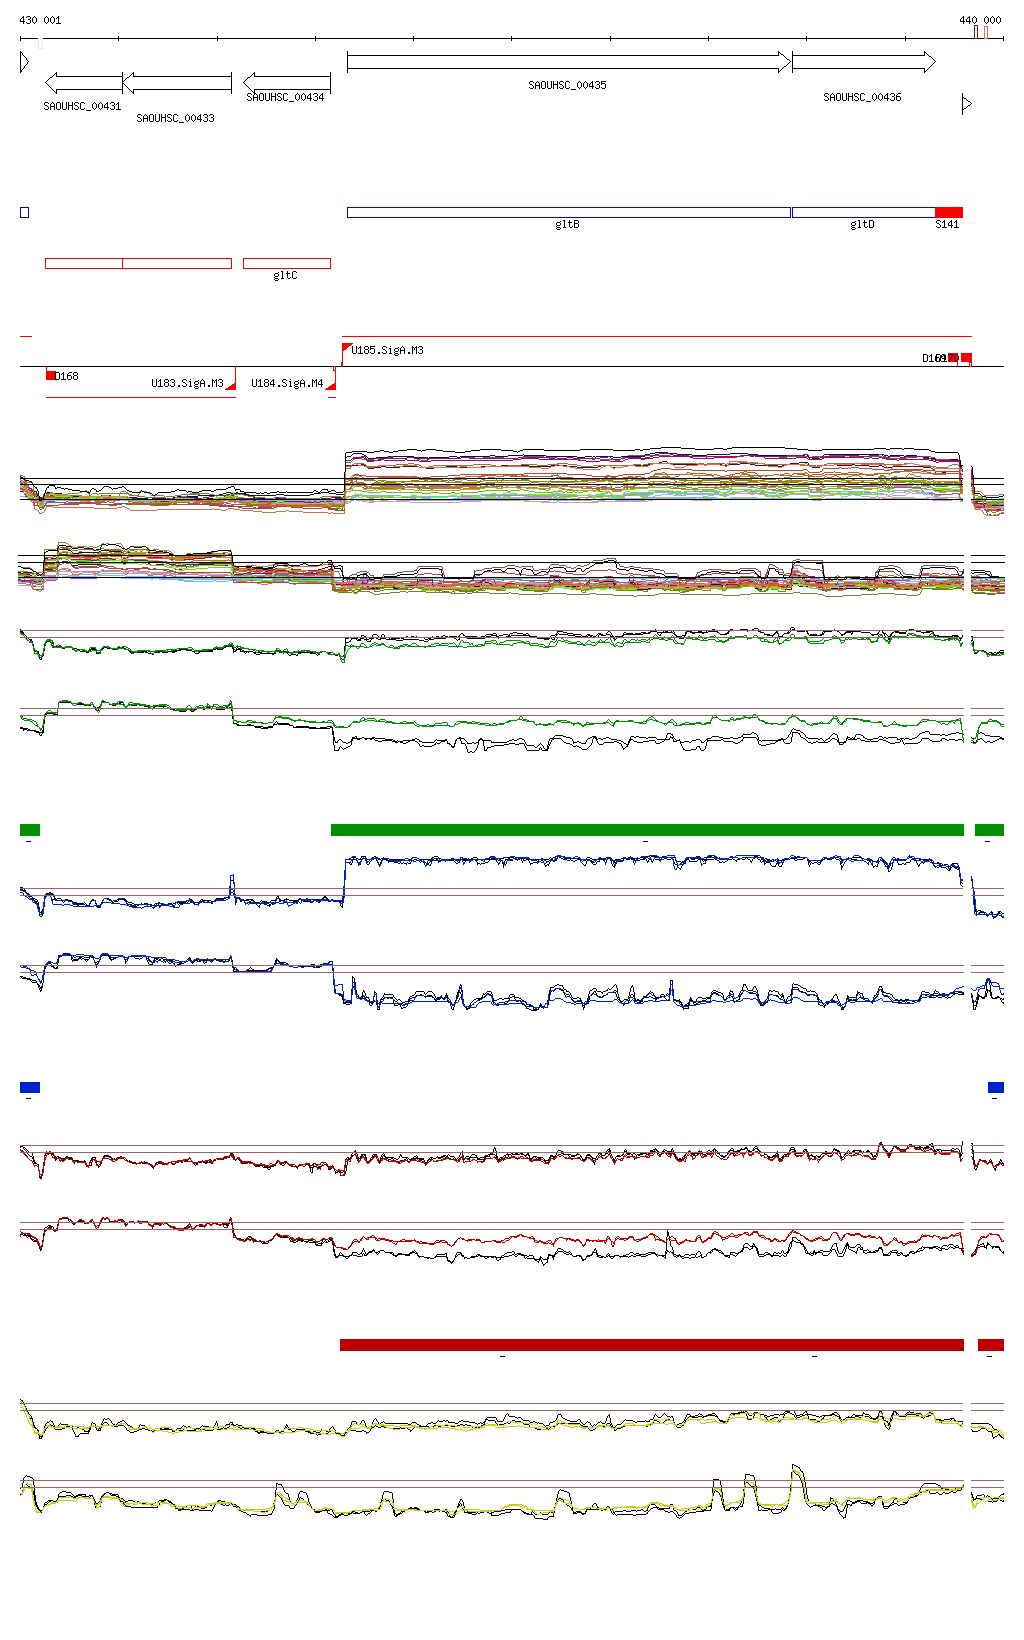
| gltD | S141 | serA | SAOUHSC_01832 | SAOUHSC_01835 | S394 | SAOUHSC_00949 | S403 | ilvB | SAOUHSC_02595 |
| 0.99 | 0.96 | 0.89 | 0.88 | 0.88 | 0.87 | 0.86 | 0.85 | 0.85 | 0.85 |
| SAOUHSC_02913 | SAOUHSC_01736 | gyrA | SAOUHSC_02747 | mvaA | S104 | rluB | S97 | hemB | thl |
| -0.74 | -0.74 | -0.74 | -0.74 | -0.74 | -0.74 | -0.72 | -0.71 | -0.71 | -0.71 |