| Start Page |
|
 |
| Start Page |
|
|
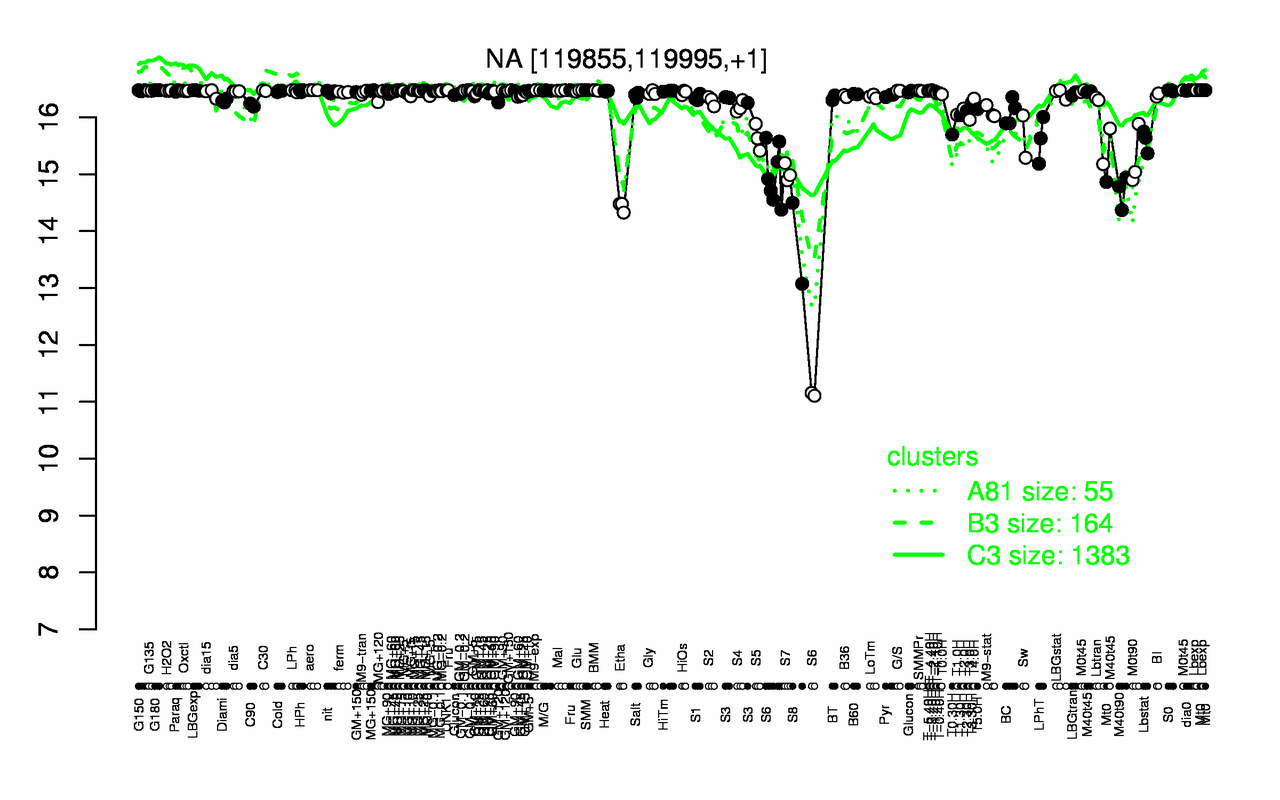
| Lbexp | SMM | T-3.40H | UNK1 | G180 | M9-exp | MG+15 | aero | LBGexp | MG+25 |
| 16.5 | 16.5 | 16.5 | 16.5 | 16.5 | 16.5 | 16.5 | 16.5 | 16.5 | 16.5 |
| S8 | S6 | Etha | M40t90 | S7 | M0t90 | Lbstat | LPhT | S5 | Sw |
| 13.8 | 14.1 | 14.4 | 14.7 | 15 | 15.3 | 15.6 | 15.6 | 15.6 | 15.7 |