| Start Page |
|
 |
| Start Page |
|
|
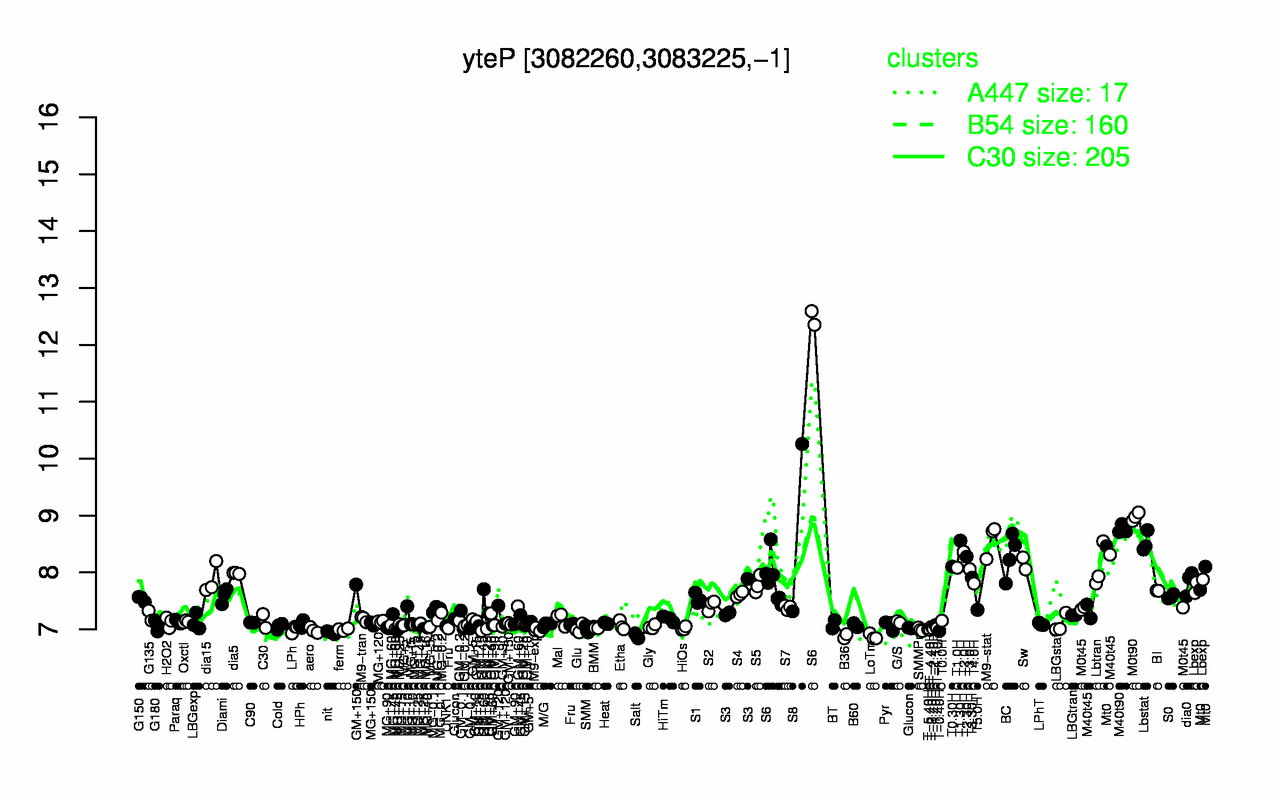
| M0t90 | S6 | S8 | M40t90 | M9-stat | T1.30H | Lbstat | T2.0H | BC | T2.30H |
| 8.98 | 8.87 | 8.79 | 8.76 | 8.57 | 8.56 | 8.53 | 8.36 | 8.3 | 8.28 |
| LoTm | B36 | Salt | nit | T-0.40H | aero | SMM | M9-exp | T-4.40H | ferm |
| 6.87 | 6.88 | 6.89 | 6.94 | 6.97 | 6.99 | 6.99 | 6.99 | 6.99 | 7 |