B. subtilis Expression Data Browser
Details about S55 Show/Hide
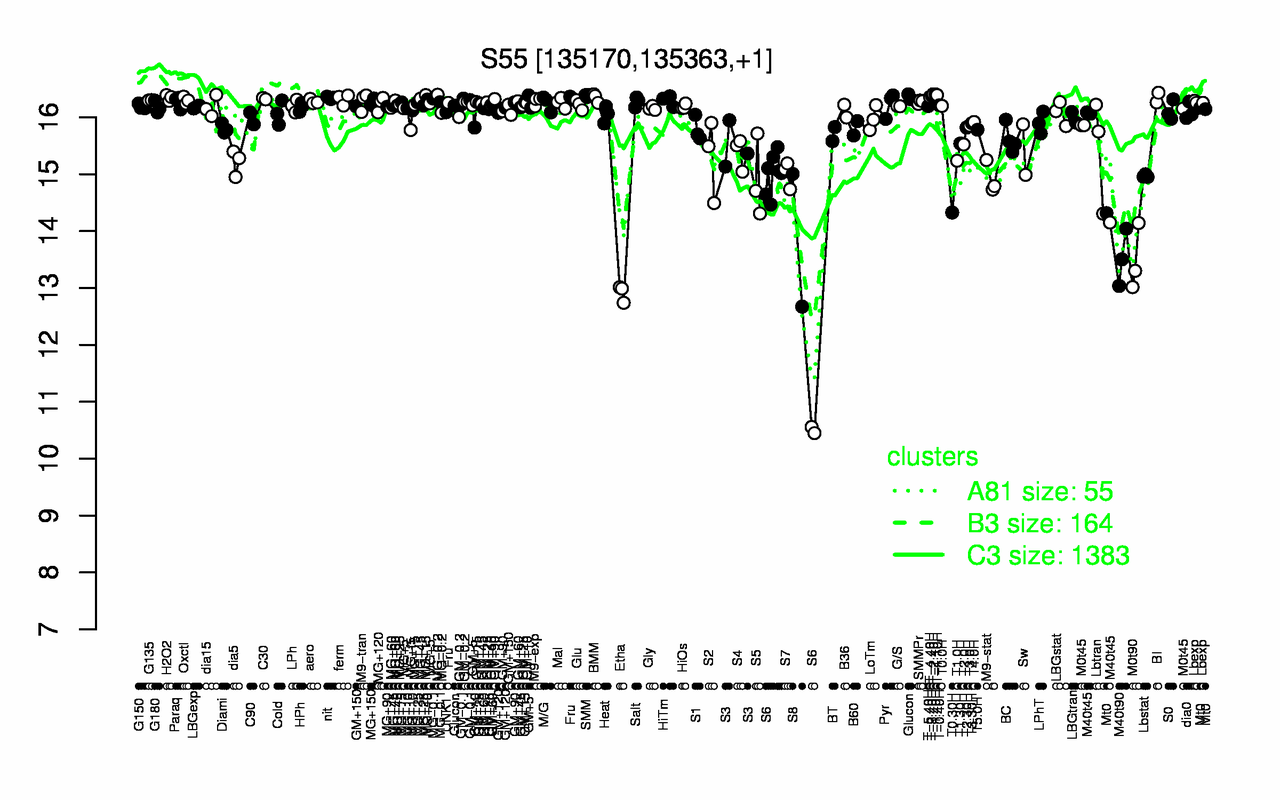
Highest Expression Conditions
T-1.40H T-2.40H T-1.10H SMM T-3.40H T-4.40H BI BMM H2O2 nit
16.4 16.4 16.4 16.4 16.4 16.4 16.3 16.3 16.3 16.3
Lowest Expression Conditions
Etha M0t90 M40t90 S8 S6 T0.30H S5 M9-stat Lbstat S7
12.9 13.5 13.5 13.8 14 14.3 14.9 14.9 15 15
Most Positively Correlated Segments
rpsJ rplB rplD rplW rplC rpsS rplV rplGB rpsL S53
0.97 0.95 0.95 0.95 0.94 0.93 0.92 0.92 0.91 0.91
Most Negatively Correlated Segments
yteP yesQ yteS yteR yesU yesO yesV yesS yesY yugM
-0.78 -0.77 -0.75 -0.75 -0.74 -0.72 -0.71 -0.7 -0.7 -0.7
Expression Profile of Segment S55 Show/Hide
Genomic View of Gene/Segment S55 Show/Hide
(Legend)