B. subtilis Expression Data Browser
Start Page
B. subtilis Expression Data Browser
Gene/Segment:
rplC
Locus Tag:
BSU01160
Details about rplC
Show/Hide
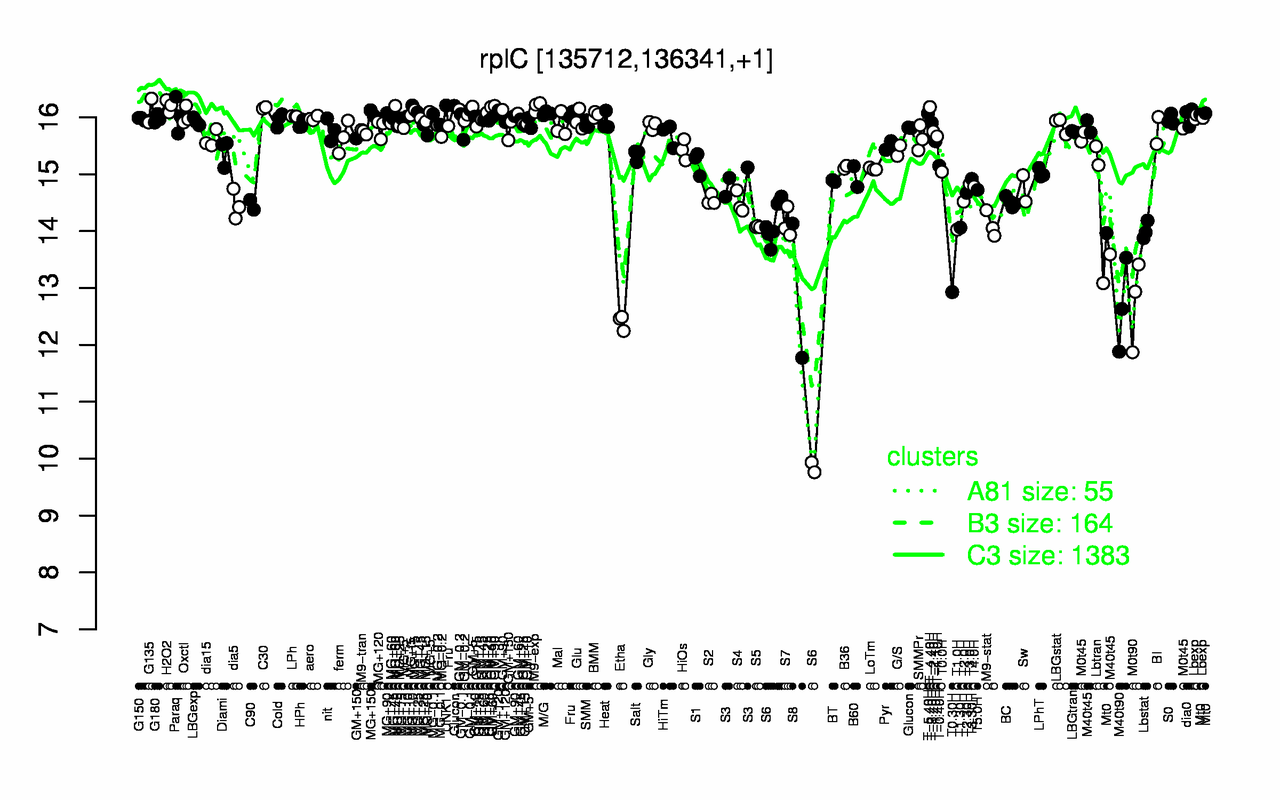
Highest Expression Conditions
UNK1
H2O2
M9-exp
T-4.40H
C30
G135
GM+90
MG+150
T-5.40H
M/G
16.2
16.2
16.2
16.2
16.2
16.1
16.1
16.1
16.1
16.1
Lowest Expression Conditions
Etha
M40t90
M0t90
T0.30H
S8
S6
Lbstat
T1.0H
T1.30H
S5
12.4
12.7
12.7
12.9
13
13.2
14
14
14.1
14.1
Most Positively Correlated Segments
rpsJ
rplD
rpsC
rplV
rplW
rplB
rplP
rpmC
rpsS
rplNA
0.98
0.97
0.96
0.96
0.96
0.96
0.96
0.95
0.95
0.94
Most Negatively Correlated Segments
yugM
S1087
abnA
yteP
S1086
yesQ
yesU
yesV
yrzF
araN
-0.79
-0.77
-0.77
-0.76
-0.76
-0.75
-0.75
-0.74
-0.74
-0.74
Expression Profile of Segment rplC
Show/Hide
Annotation of Gene rplC
Show/Hide
function
16.2: Construct biomass (Anabolism)
inference
ab initio prediction:AMIGene:2.0
codon_start
1
product
ribosomal protein L3 (BL3)
transl_table
11
note
Evidence 2a: Function of homologous gene experimentally demonstrated in an other organism; PubMedId: 12682299; Product type s: structure
db_xref
GI:2632383
protein_id
CAB11892.1
Genomic View of Gene/Segment rplC
Show/Hide
(Legend)
Browse Genome Context