| Start Page |
|
 |
| Start Page |
|
|
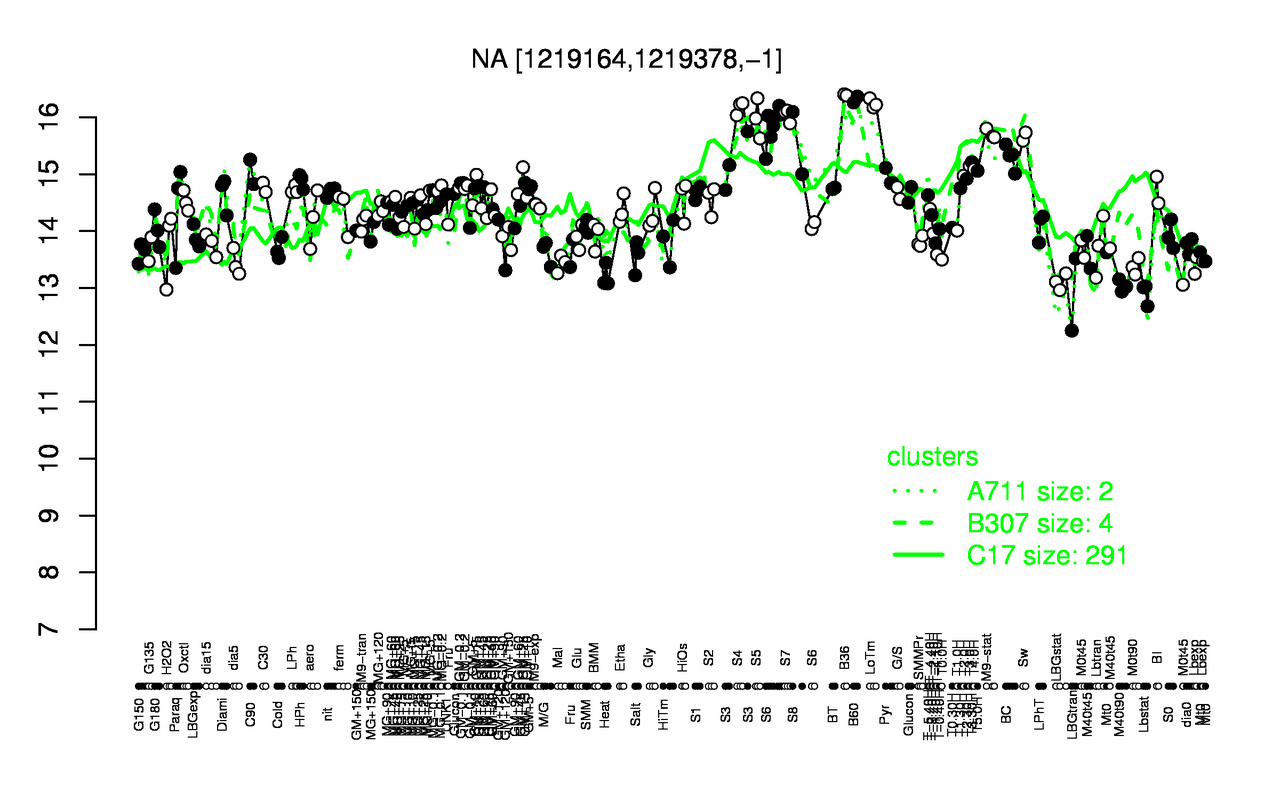
| B36 | B60 | LoTm | S4 | S7 | S5 | M9-stat | Sw | S8 | S6 |
| 16.4 | 16.3 | 16.2 | 16.2 | 16 | 16 | 15.7 | 15.7 | 15.5 | 15.5 |
| LBGtran | Lbstat | M40t90 | LBGstat | Heat | M0t90 | Lbexp | Mal | dia5 | M0t45 |
| 12.9 | 12.9 | 13 | 13.1 | 13.2 | 13.4 | 13.4 | 13.4 | 13.4 | 13.5 |