B. subtilis Expression Data Browser
Details about NA Show/Hide
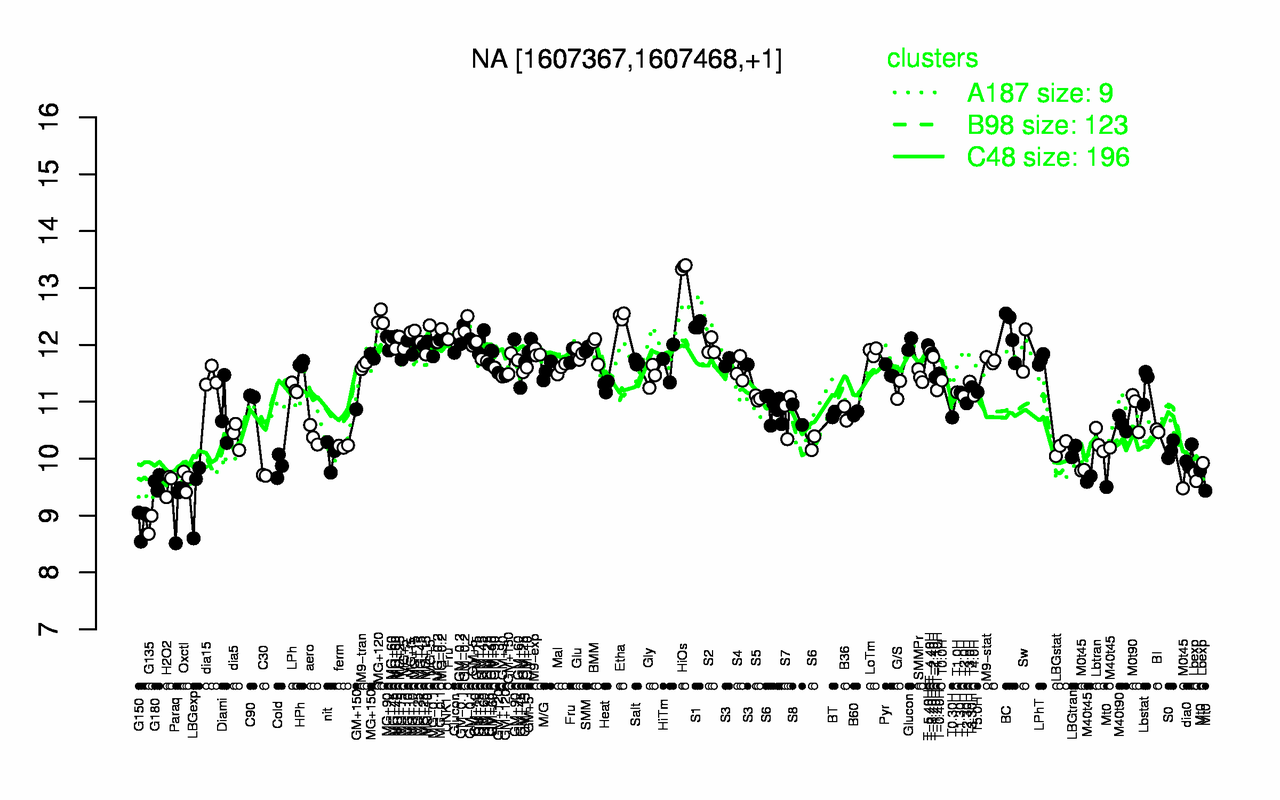
Highest Expression Conditions
HiOs Etha MG+120 S1 GM-0.2 MG+t5 BC MG-0.2 GM-0.1 MG+5
13.4 12.5 12.5 12.3 12.3 12.2 12.2 12.2 12.2 12.1
Lowest Expression Conditions
G135 G150 Paraq LBGexp H2O2 Mt0 G180 Oxctl M0t45 C30
8.84 8.88 9.13 9.36 9.55 9.58 9.58 9.62 9.69 9.71
Most Positively Correlated Segments
ylmA ilvD S822 yocS yhjB yhjC S368 yhaA NA S823
0.86 0.86 0.85 0.84 0.83 0.83 0.82 0.82 0.82 0.82
Most Negatively Correlated Segments
murF pbuE ansA S893 yfkO ansB ddl treP S892 treA
-0.72 -0.71 -0.71 -0.7 -0.7 -0.7 -0.69 -0.69 -0.68 -0.68
Expression Profile of Segment NA Show/Hide
Genomic View of Gene/Segment NA Show/Hide
(Legend)