| Start Page |
|
 |
| Start Page |
|
|
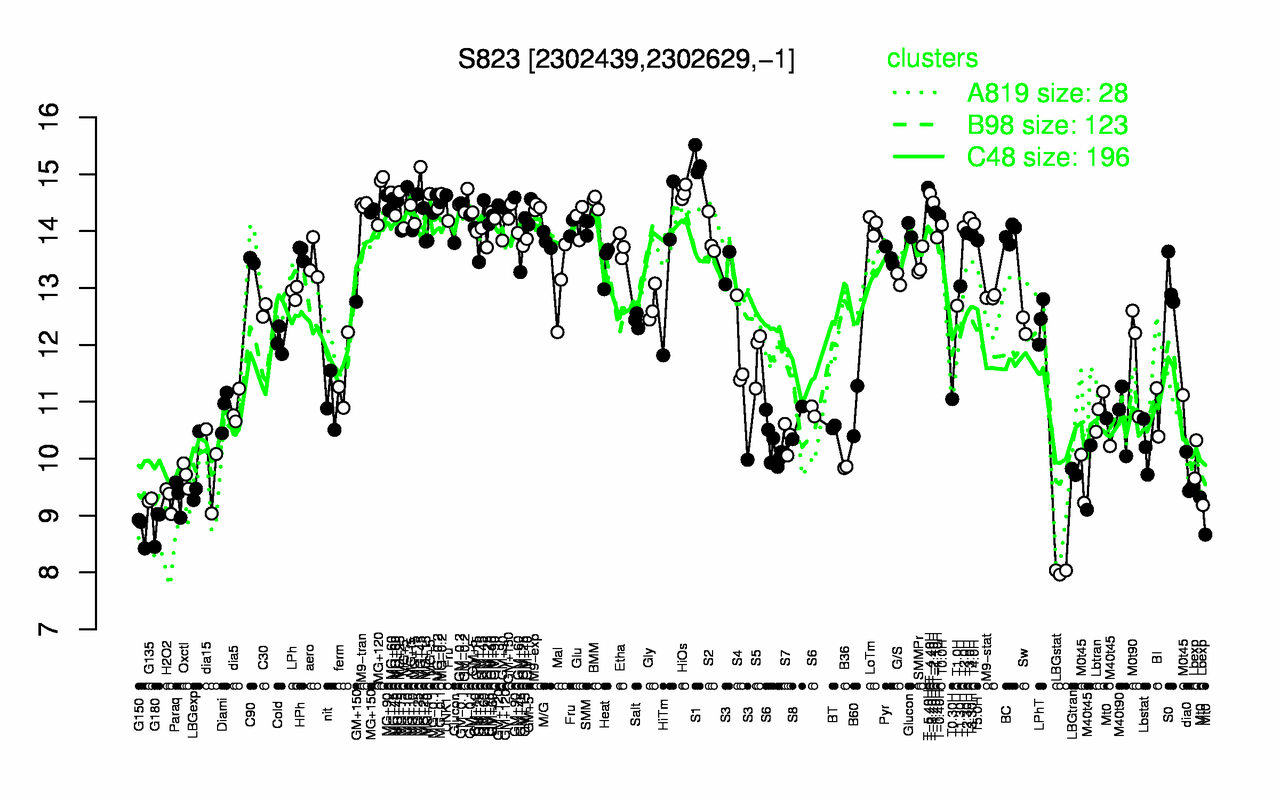
| S1 | T-5.40H | MG+45 | HiOs | T-4.40H | MG+120 | UNK1 | MG+25 | MG-0.2 | GM-0.2 |
| 15.2 | 14.8 | 14.7 | 14.7 | 14.7 | 14.6 | 14.6 | 14.6 | 14.5 | 14.5 |
| LBGstat | G150 | G180 | G135 | H2O2 | Paraq | Mt0 | dia0 | Oxctl | Lbexp |
| 8.01 | 8.74 | 8.83 | 9.28 | 9.29 | 9.31 | 9.57 | 9.68 | 9.7 | 9.72 |