| Start Page |
|
 |
| Start Page |
|
|
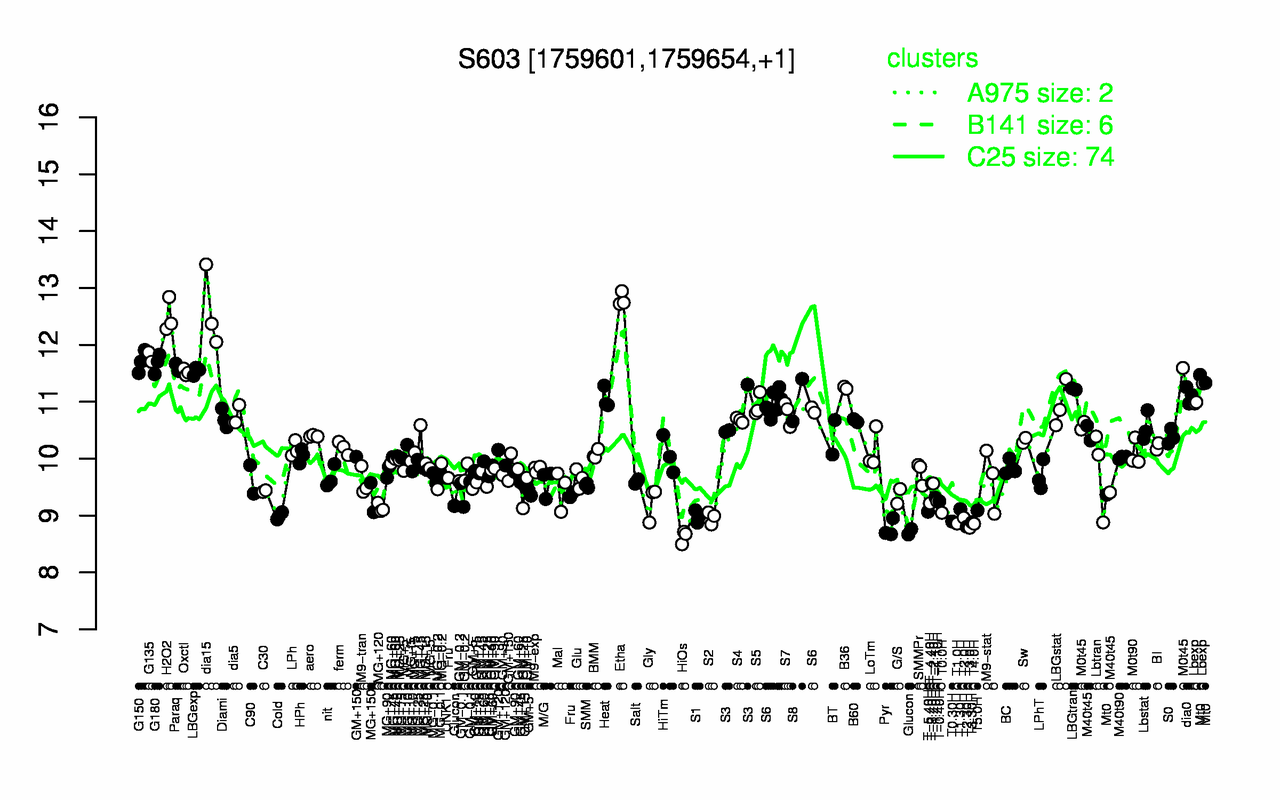
| Etha | dia15 | H2O2 | G135 | G150 | G180 | Paraq | LBGexp | Oxctl | B36 |
| 12.8 | 12.6 | 12.5 | 11.8 | 11.7 | 11.7 | 11.6 | 11.5 | 11.5 | 11.2 |
| HiOs | Pyr | T3.0H | T2.30H | T4.0H | T1.0H | Glucon | T3.30H | T0.30H | T2.0H |
| 8.63 | 8.77 | 8.79 | 8.81 | 8.86 | 8.86 | 8.87 | 8.88 | 8.9 | 8.96 |