| Start Page |
|
 |
| Start Page |
|
|
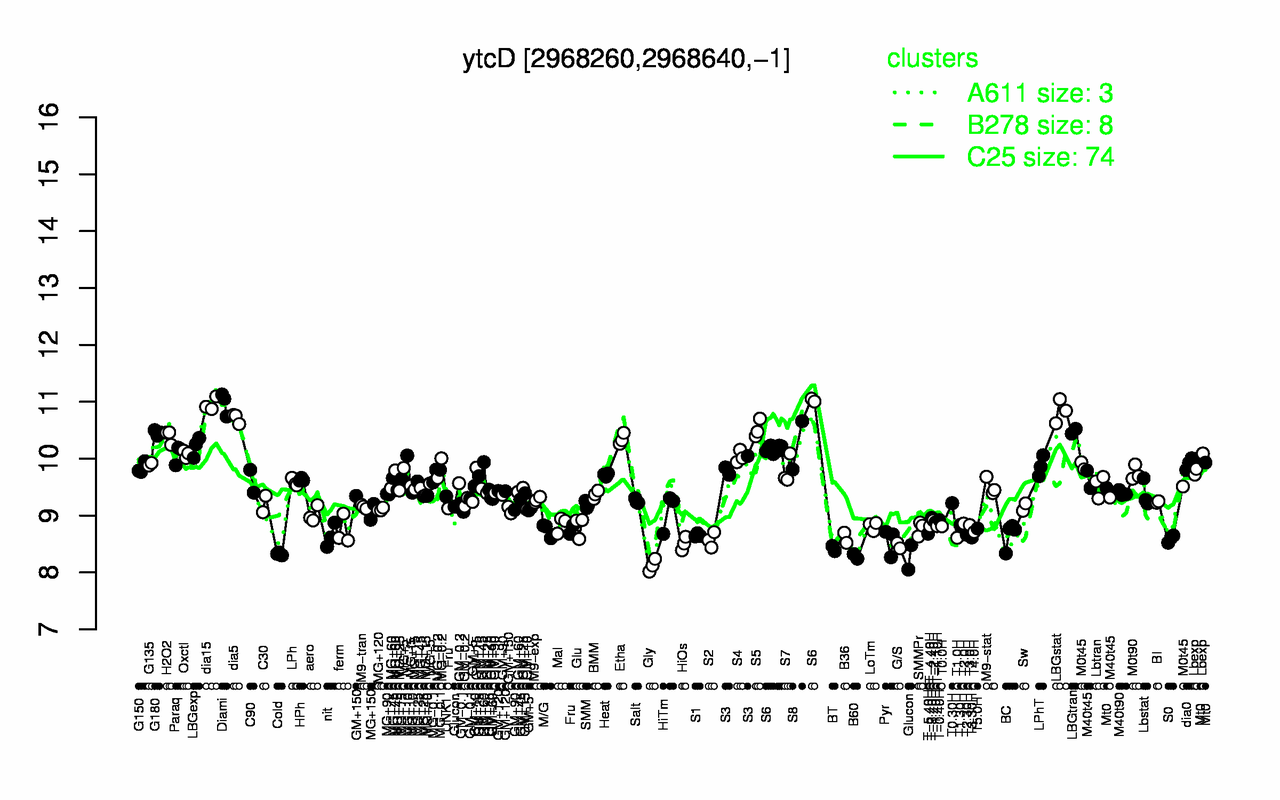
| Diami | dia15 | LBGstat | dia5 | S5 | LBGtran | G180 | H2O2 | S6 | Etha |
| 11 | 11 | 10.8 | 10.7 | 10.5 | 10.5 | 10.5 | 10.4 | 10.4 | 10.3 |
| Gly | B60 | Cold | BT | G/S | HiOs | Pyr | Glucon | S2 | S0 |
| 8.12 | 8.28 | 8.33 | 8.42 | 8.47 | 8.51 | 8.55 | 8.56 | 8.57 | 8.59 |