| Start Page |
|
 |
| Start Page |
|
|
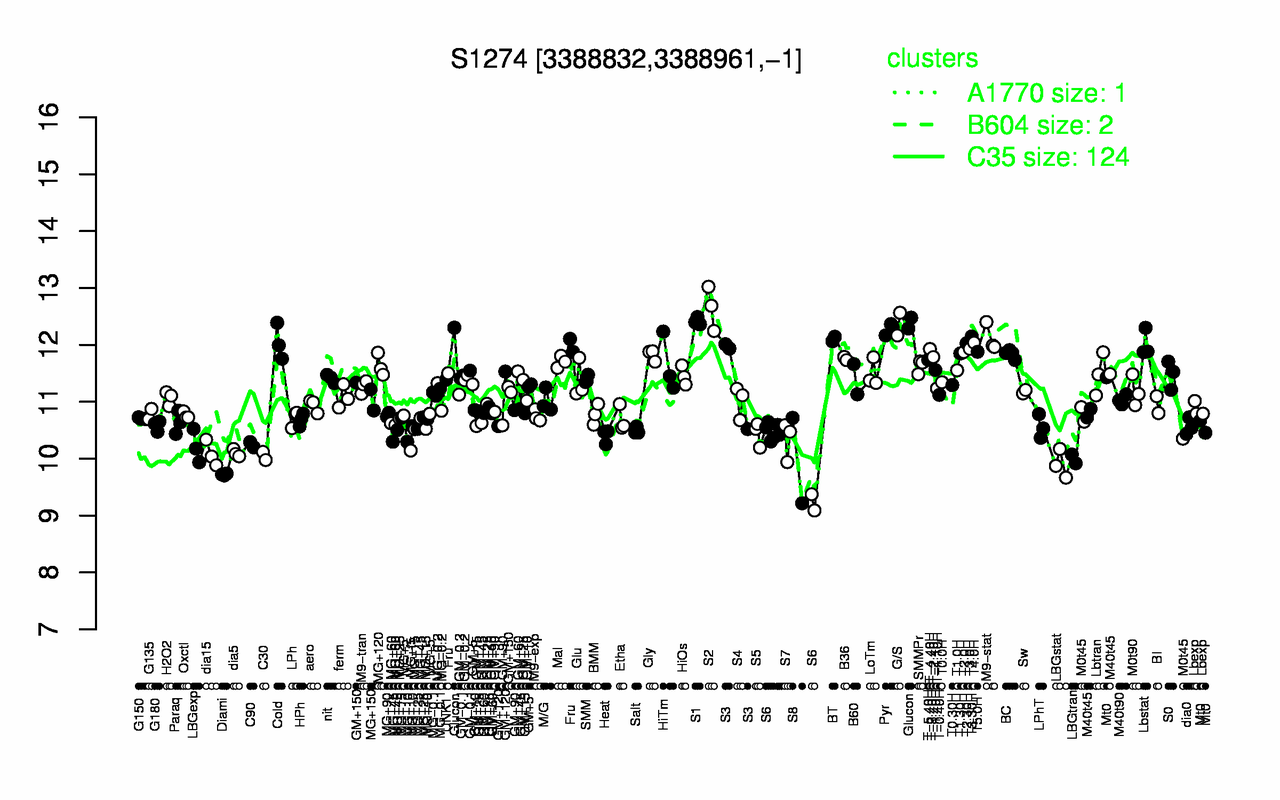
| S2 | S1 | G/S | Glucon | Pyr | T3.30H | M9-stat | BT | Cold | T4.0H |
| 12.7 | 12.4 | 12.4 | 12.4 | 12.3 | 12.1 | 12.1 | 12.1 | 12 | 12 |
| Diami | LBGstat | S8 | LBGtran | C30 | dia15 | dia5 | MG+t5 | LBGexp | S6 |
| 9.72 | 9.9 | 9.97 | 10 | 10 | 10.1 | 10.1 | 10.1 | 10.2 | 10.2 |