B. subtilis Expression Data Browser
Details about scuA Show/Hide
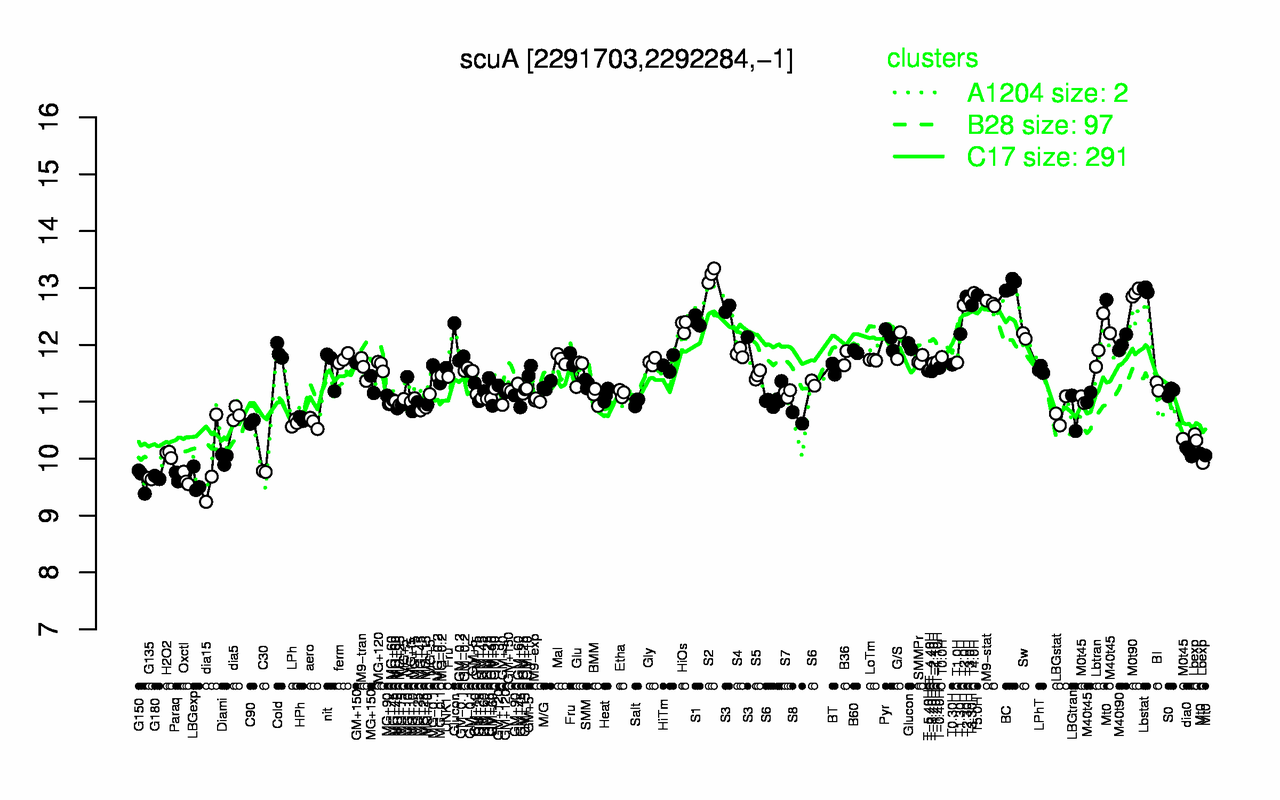
Highest Expression Conditions
S2 BC Lbstat M0t90 T4.0H T5.0H T2.30H T3.0H M9-stat T2.0H
13.2 13.1 13 12.9 12.9 12.9 12.8 12.8 12.7 12.7
Lowest Expression Conditions
LBGexp G150 Oxctl G135 G180 Paraq C30 dia15 Diami H2O2
9.6 9.64 9.64 9.65 9.67 9.7 9.77 9.9 10 10.1
Most Positively Correlated Segments
S819 kinE yoxA dacC S748 ymaH yisT phrK yozM S338
0.92 0.89 0.87 0.86 0.86 0.85 0.84 0.83 0.83 0.83
Most Negatively Correlated Segments
speB yutK speE tcyB tcyC yfmL ytbD pyrG speA tcyA
-0.88 -0.84 -0.83 -0.82 -0.81 -0.81 -0.8 -0.8 -0.79 -0.79
Expression Profile of Segment scuA Show/Hide
Annotation of Gene scuA Show/Hide
function
16.10: Respire
inference
ab initio prediction:AMIGene:2.0
codon_start
1
product
assembly factor BSco of the Cu(A) site of cytochrome c oxidase
transl_table
11
note
Evidence 1a: Function experimentally demonstrated in the studied strain; PubMedId: 14680962, 14766920, 16305244, 19027886, 10837475; Product type f: factor
db_xref
GI:225185103
protein_id
CAB14093.2
Genomic View of Gene/Segment scuA Show/Hide
(Legend)