| Start Page |
|
 |
| Start Page |
|
|
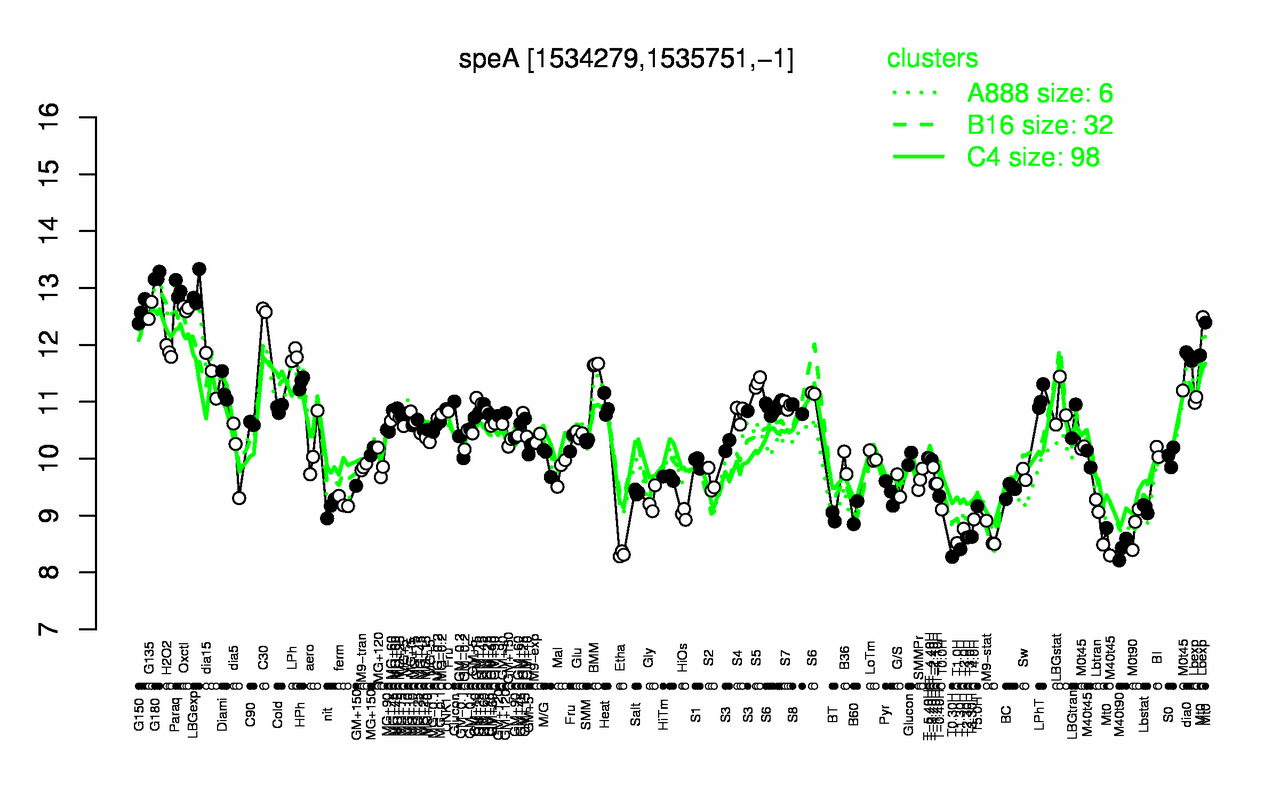
| G180 | Paraq | LBGexp | Oxctl | C30 | G135 | G150 | H2O2 | LPh | dia0 |
| 13.2 | 13 | 13 | 12.6 | 12.6 | 12.6 | 12.6 | 11.9 | 11.8 | 11.8 |
| T0.30H | Etha | T1.30H | M40t90 | T1.0H | T2.30H | T3.30H | T3.0H | M9-stat | T2.0H |
| 8.27 | 8.32 | 8.41 | 8.41 | 8.52 | 8.61 | 8.63 | 8.63 | 8.64 | 8.77 |