| Start Page |
|
 |
| Start Page |
|
|
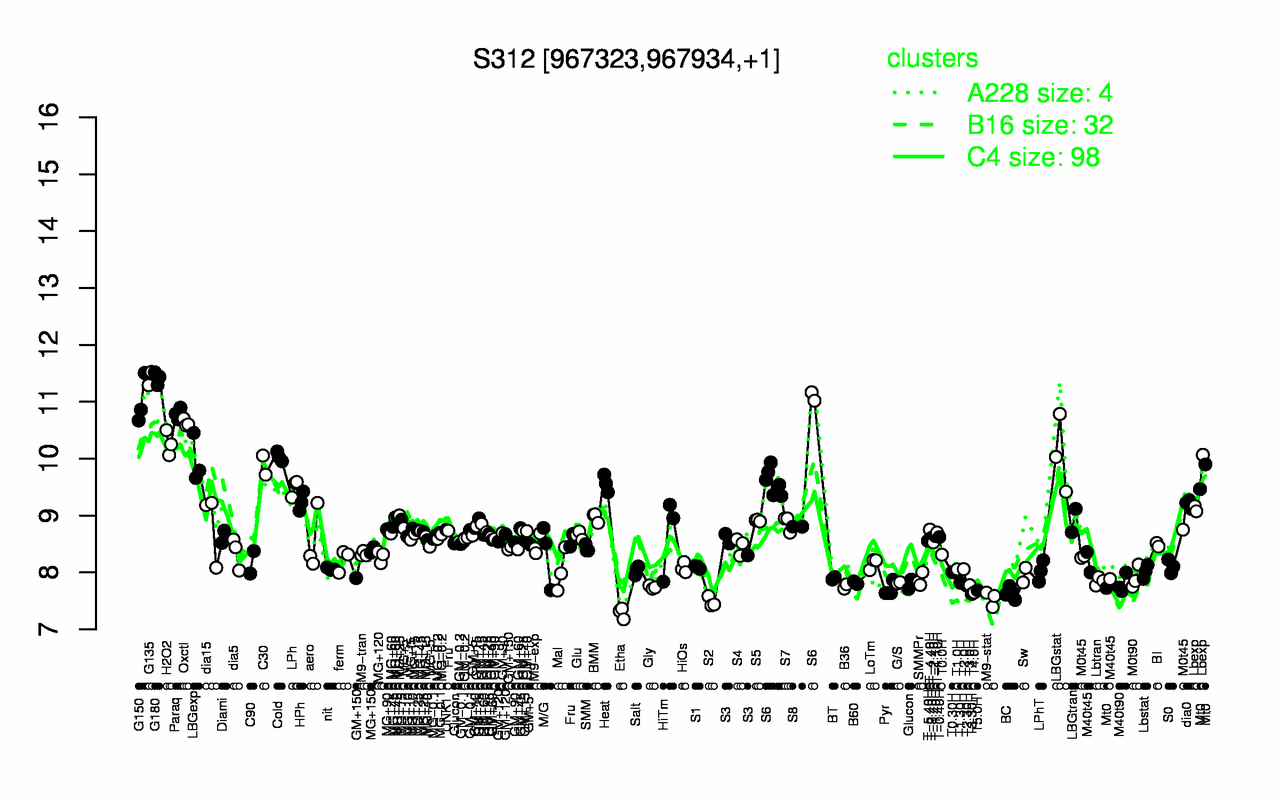
| G180 | G135 | G150 | Paraq | Oxctl | H2O2 | LBGstat | Cold | LBGexp | S6 |
| 11.4 | 11.4 | 11 | 10.8 | 10.6 | 10.3 | 10.1 | 10 | 9.97 | 9.92 |
| Etha | S2 | M9-stat | T3.30H | BC | T4.0H | T5.0H | Pyr | Gly | B36 |
| 7.29 | 7.48 | 7.54 | 7.62 | 7.64 | 7.65 | 7.69 | 7.72 | 7.74 | 7.75 |