B. subtilis Expression Data Browser
Details about S1101 Show/Hide
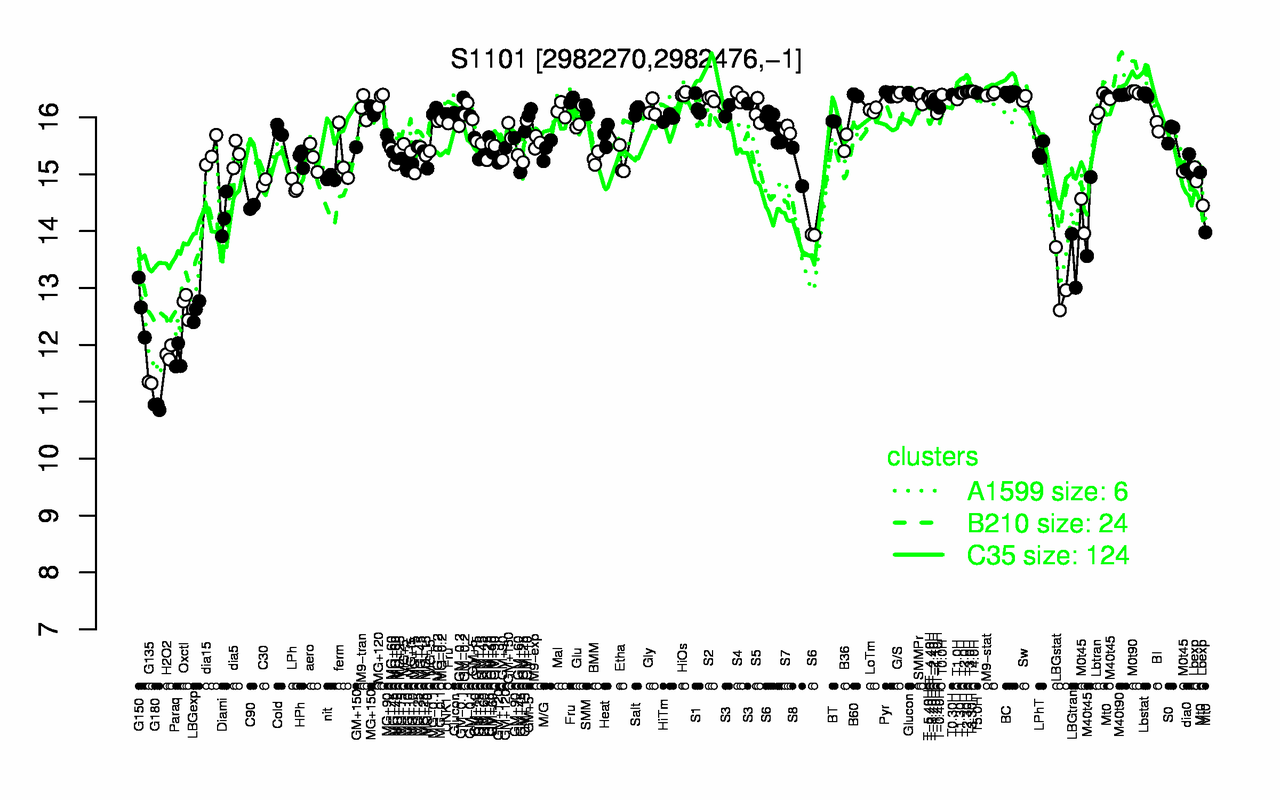
Highest Expression Conditions
T3.0H T3.30H T2.30H T4.0H M0t90 T2.0H T1.30H T5.0H BC Pyr
16.5 16.5 16.5 16.5 16.4 16.4 16.4 16.4 16.4 16.4
Lowest Expression Conditions
G180 G135 Paraq H2O2 LBGexp G150 Oxctl LBGstat LBGtran Diami
10.9 11.3 11.8 11.9 12.6 12.7 12.7 13.1 13.5 14.3
Most Positively Correlated Segments
citZ S1100 S1099 S1309 yjcG S404 appA mtnK mtnA yhaA
0.97 0.95 0.86 0.84 0.82 0.82 0.81 0.81 0.81 0.8
Most Negatively Correlated Segments
yyzO ywpE yfhI S290 yhbA S312 S1255 yugK S1527 yxaF
-0.86 -0.83 -0.8 -0.79 -0.79 -0.78 -0.77 -0.77 -0.76 -0.76
Expression Profile of Segment S1101 Show/Hide
Genomic View of Gene/Segment S1101 Show/Hide
(Legend)