| Start Page |
|
 |
| Start Page |
|
|
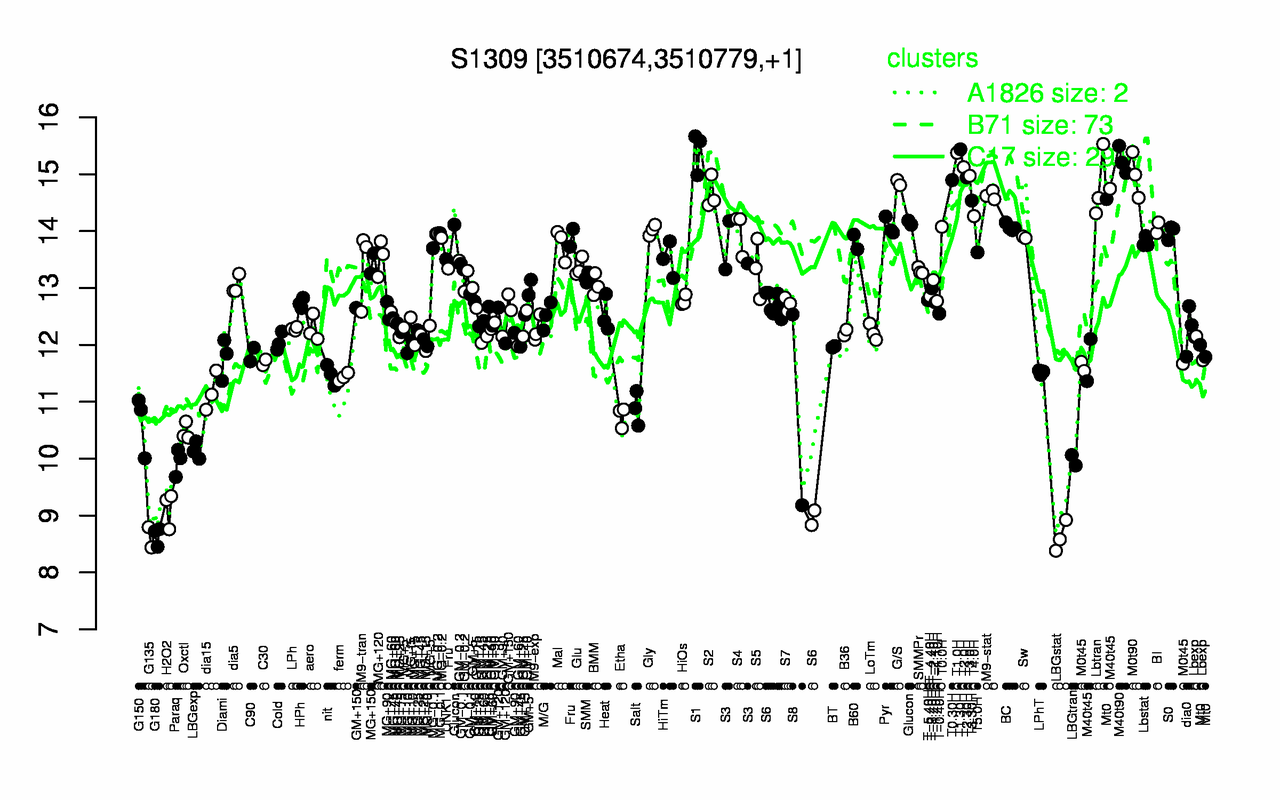
| T1.30H | S1 | T1.0H | M40t90 | T2.0H | M0t90 | T3.0H | T2.30H | T0.30H | G/S |
| 15.4 | 15.4 | 15.4 | 15.2 | 15.1 | 15 | 15 | 14.9 | 14.9 | 14.9 |
| G135 | LBGstat | G180 | H2O2 | Paraq | LBGtran | LBGexp | Oxctl | G150 | Etha |
| 8.62 | 8.63 | 8.65 | 9.12 | 9.95 | 9.97 | 10.1 | 10.5 | 10.6 | 10.7 |