| Start Page |
|
 |
| Start Page |
|
|
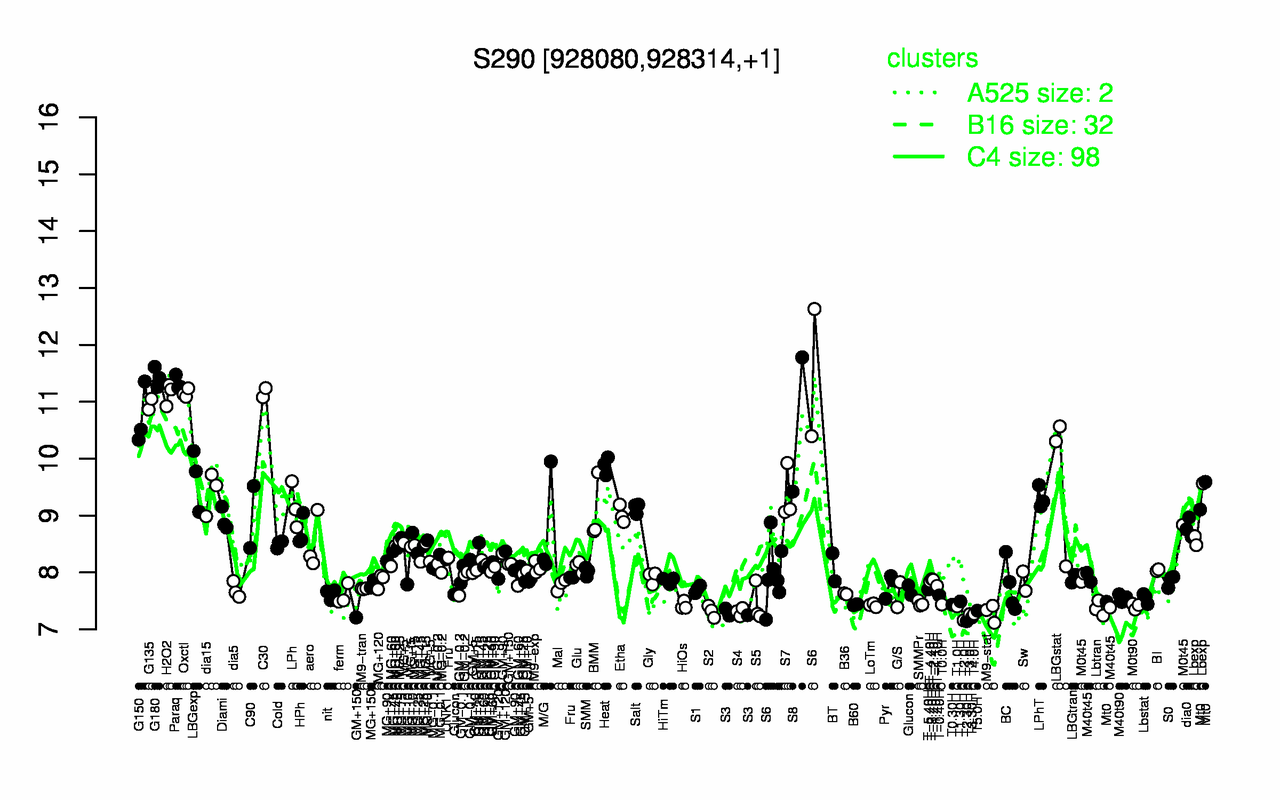
| G180 | Paraq | C30 | Oxctl | H2O2 | G135 | G150 | S8 | Heat | LBGstat |
| 11.4 | 11.3 | 11.2 | 11.2 | 11.1 | 11 | 10.7 | 10.6 | 9.88 | 9.66 |
| T2.30H | T2.0H | T3.30H | T3.0H | T4.0H | S3 | M9-stat | S4 | S2 | T5.0H |
| 7.14 | 7.16 | 7.21 | 7.27 | 7.27 | 7.28 | 7.29 | 7.31 | 7.32 | 7.33 |