| Start Page |
|
 |
| Start Page |
|
|
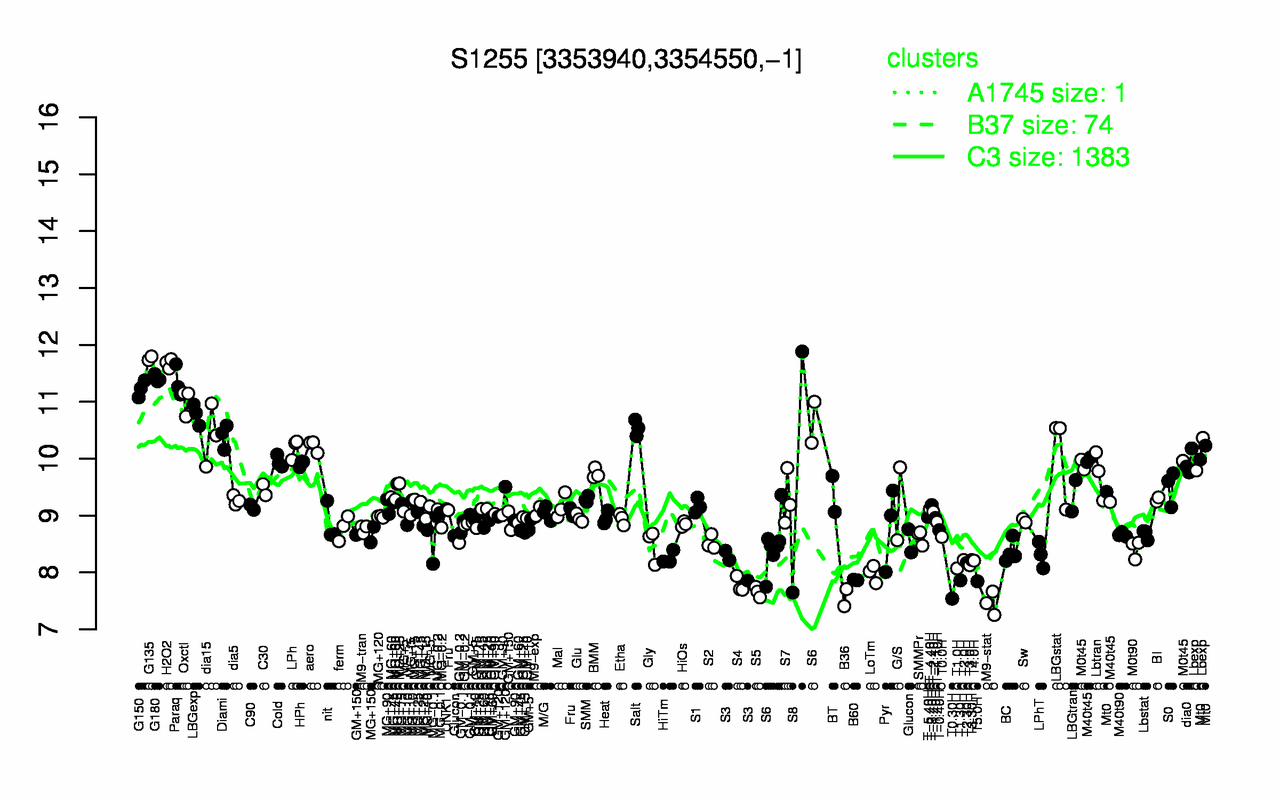
| G135 | H2O2 | G180 | Paraq | G150 | Oxctl | LBGexp | Salt | dia15 | Diami |
| 11.8 | 11.7 | 11.4 | 11.3 | 11.2 | 11 | 10.8 | 10.5 | 10.4 | 10.4 |
| M9-stat | T0.30H | B36 | S5 | S4 | T5.0H | T1.30H | B60 | LoTm | T1.0H |
| 7.46 | 7.54 | 7.56 | 7.66 | 7.78 | 7.84 | 7.86 | 7.87 | 7.98 | 8.07 |