| Start Page |
|
 |
| Start Page |
|
|
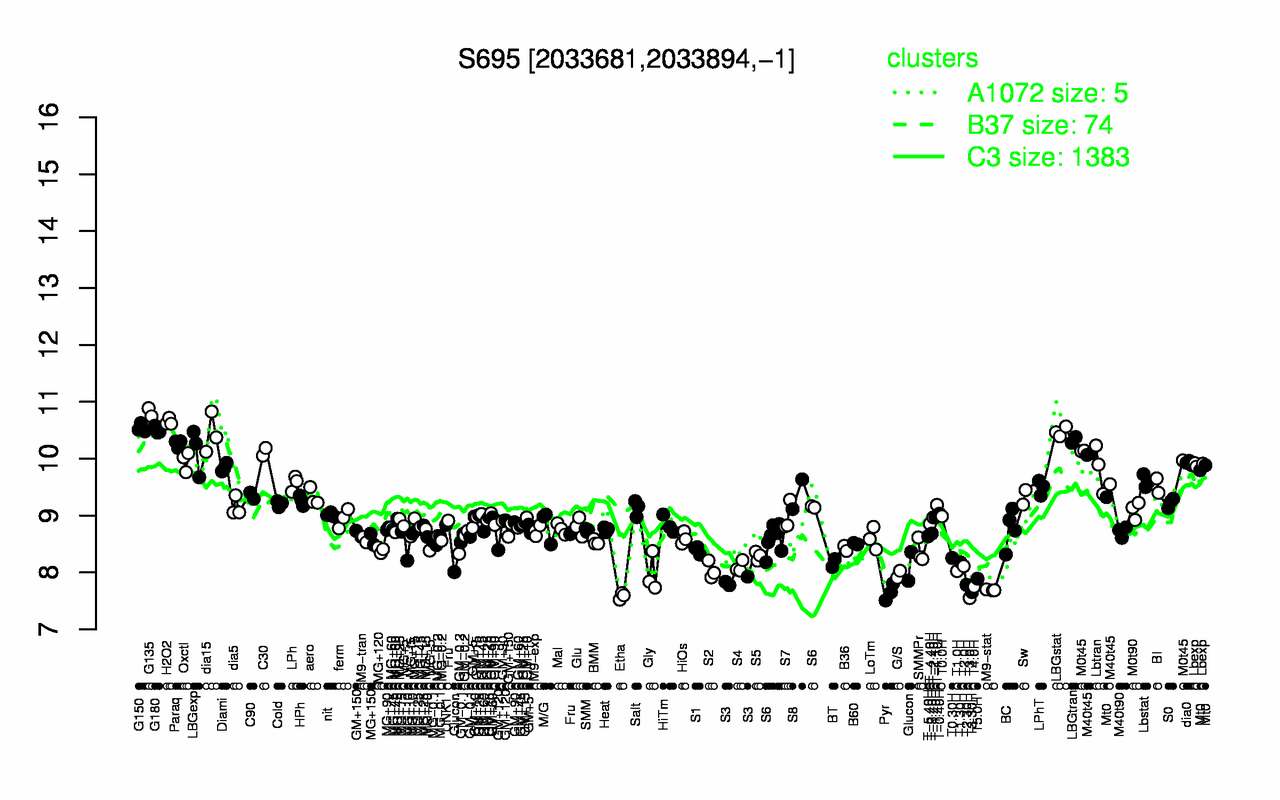
| G135 | H2O2 | G150 | G180 | LBGstat | dia15 | LBGtran | Paraq | LBGexp | C30 |
| 10.8 | 10.6 | 10.5 | 10.5 | 10.5 | 10.4 | 10.3 | 10.3 | 10.1 | 10.1 |
| T3.0H | Etha | T3.30H | Pyr | M9-stat | T4.0H | T2.30H | S3 | T5.0H | G/S |
| 7.55 | 7.59 | 7.65 | 7.66 | 7.69 | 7.75 | 7.78 | 7.85 | 7.89 | 7.97 |