| Start Page |
|
 |
| Start Page |
|
|
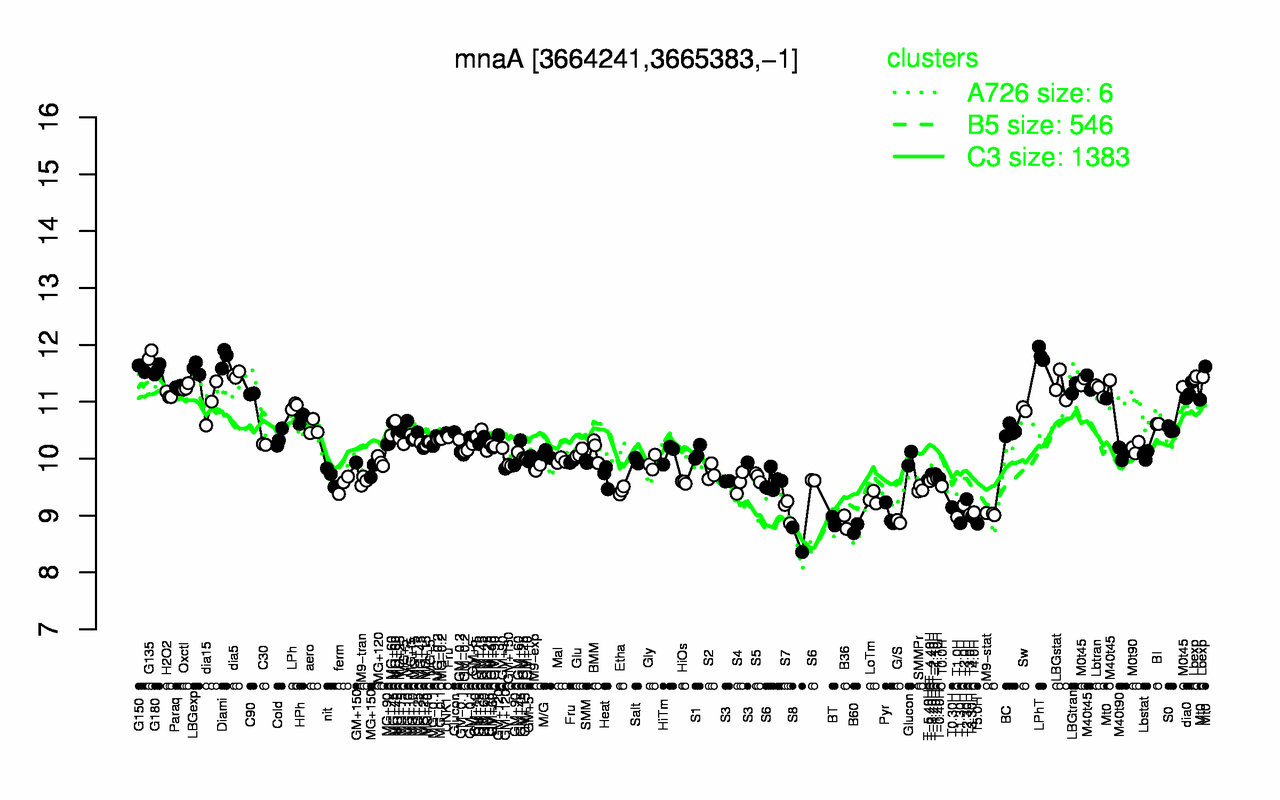
| LPhT | G135 | Diami | G150 | LBGexp | G180 | dia5 | Lbexp | M40t45 | M0t45 |
| 11.8 | 11.8 | 11.8 | 11.6 | 11.6 | 11.6 | 11.5 | 11.4 | 11.4 | 11.3 |
| S8 | B60 | T5.0H | T1.30H | B36 | G/S | BT | T1.0H | T3.30H | Pyr |
| 8.58 | 8.77 | 8.86 | 8.87 | 8.88 | 8.89 | 8.9 | 8.97 | 8.99 | 9 |