| Start Page |
|
 |
| Start Page |
|
|
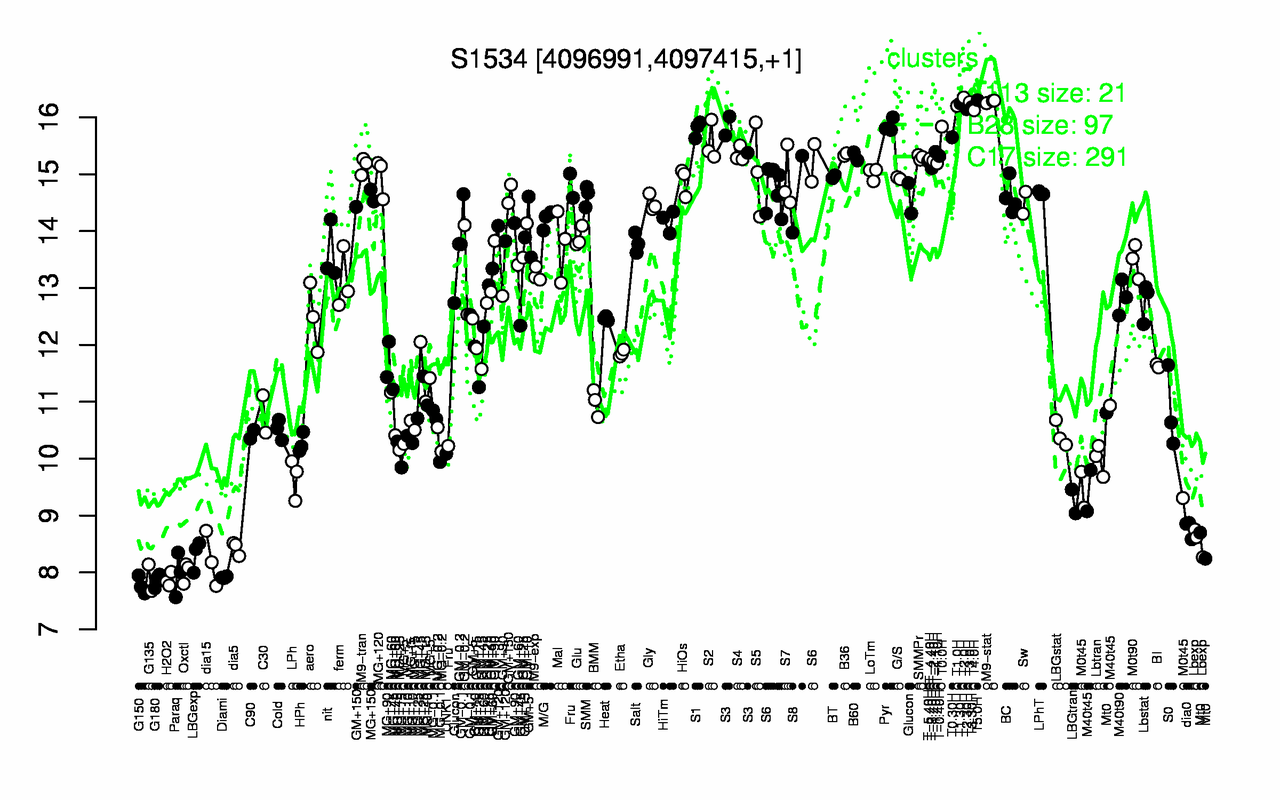
| T2.0H | T5.0H | M9-stat | T3.0H | T1.30H | T1.0H | T3.30H | T2.30H | T4.0H | Pyr |
| 16.3 | 16.3 | 16.3 | 16.3 | 16.2 | 16.2 | 16.2 | 16.1 | 16.1 | 15.9 |
| G150 | G180 | H2O2 | G135 | Diami | Paraq | Oxctl | dia15 | LBGexp | dia5 |
| 7.77 | 7.86 | 7.87 | 7.91 | 7.91 | 7.97 | 8.01 | 8.22 | 8.31 | 8.43 |