| Start Page |
|
 |
| Start Page |
|
|
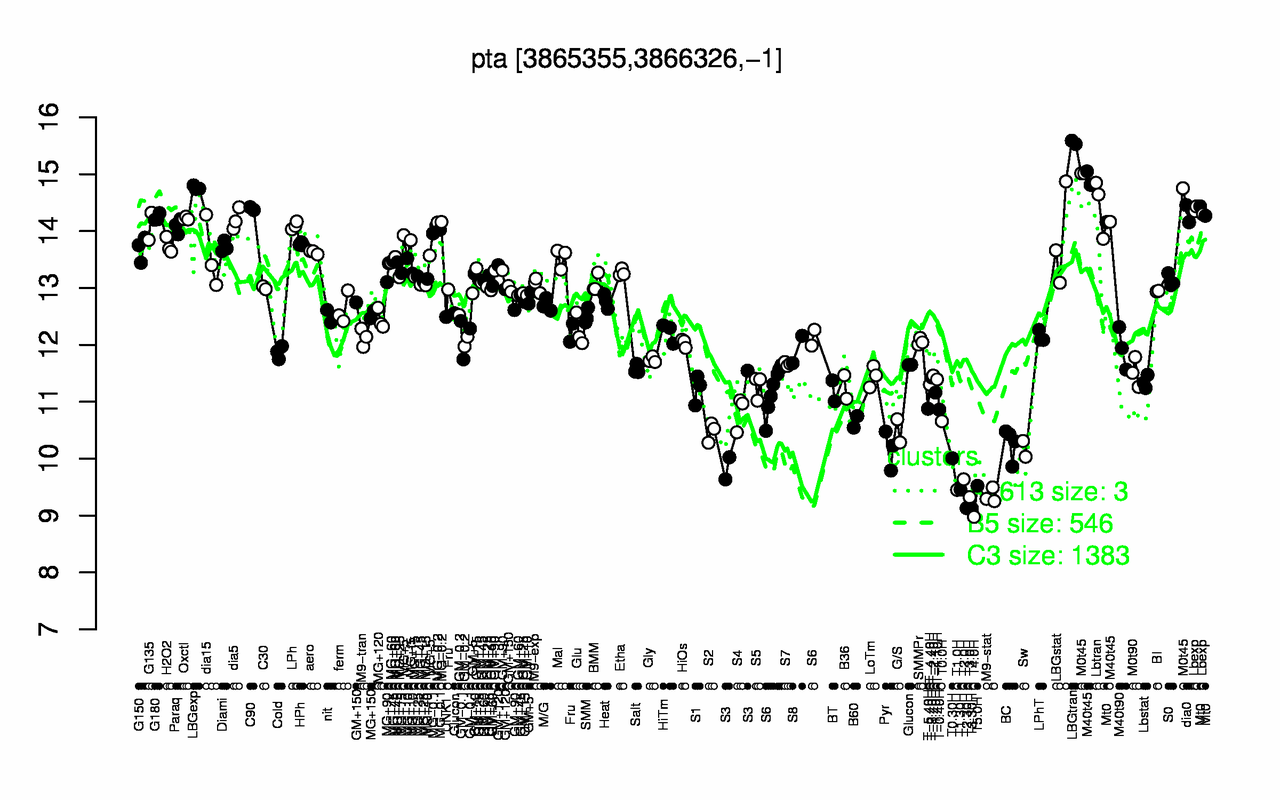
| LBGtran | M0t45 | LBGexp | M40t45 | Lbtran | C90 | Lbexp | dia0 | Mt0 | G180 |
| 15.6 | 14.9 | 14.8 | 14.7 | 14.5 | 14.4 | 14.4 | 14.3 | 14.3 | 14.2 |
| T4.0H | T3.30H | T2.30H | T3.0H | M9-stat | T1.0H | T1.30H | T5.0H | T2.0H | T0.30H |
| 8.98 | 9.12 | 9.13 | 9.32 | 9.35 | 9.45 | 9.46 | 9.52 | 9.64 | 10 |