B. subtilis Expression Data Browser
Start Page
B. subtilis Expression Data Browser
Gene/Segment:
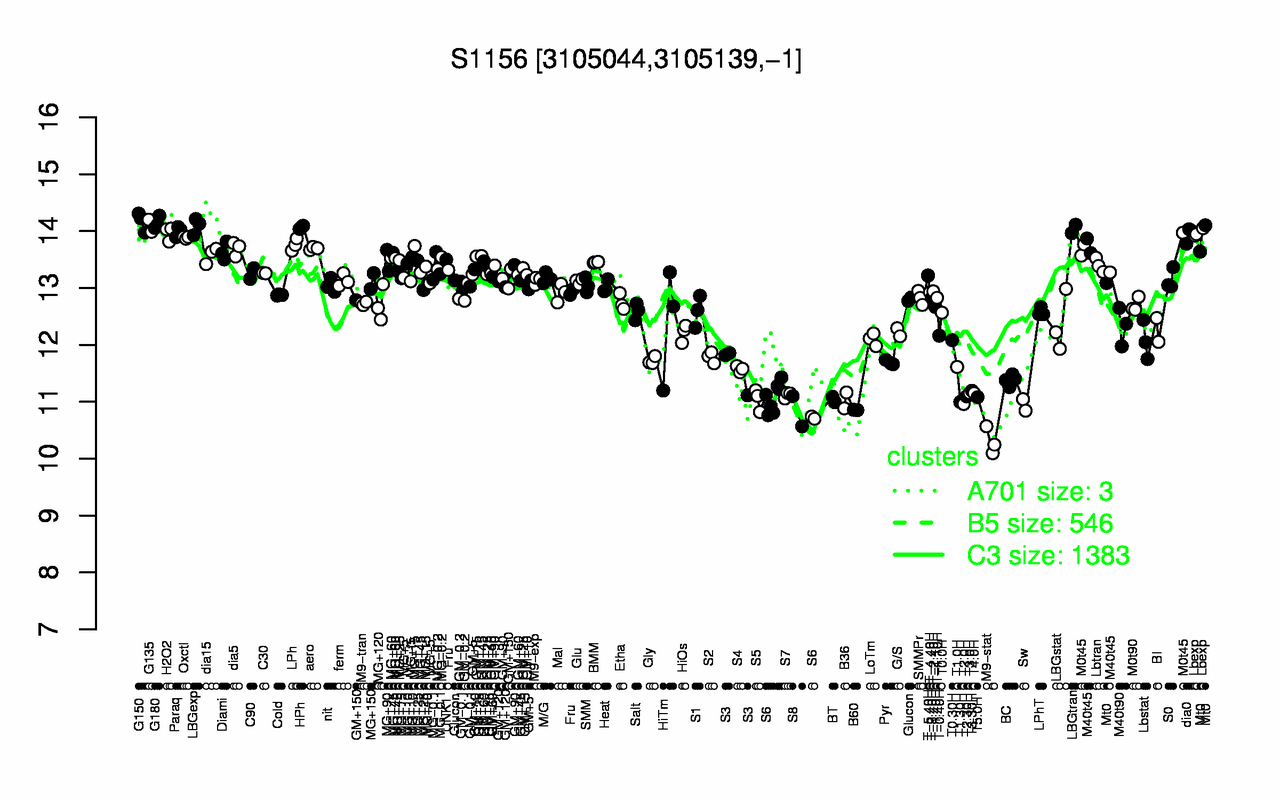
S1156
Locus Tag:
new_3105044_3105139_c
Details about S1156
Show/Hide
Highest Expression Conditions
G150
G180
G135
LBGexp
HPh
LBGtran
Paraq
Lbexp
H2O2
dia0
14.2
14.1
14.1
14.1
14.1
14
14
14
14
13.9
Lowest Expression Conditions
M9-stat
S8
B60
Sw
T2.0H
T1.30H
S6
B36
BT
S5
10.3
10.8
10.9
10.9
11
11
11
11
11
11
Most Positively Correlated Segments
leuS
S1040
fabL
S298
yitZ
ydiC
ywfL
yybG
S199
ptsI
0.93
0.91
0.9
0.9
0.89
0.89
0.89
0.89
0.89
0.89
Most Negatively Correlated Segments
sigF
spoIIAB
ggt
spoIIAA
S1128
ispA
S471
mpr
yttP
ybfJ
-0.89
-0.88
-0.88
-0.87
-0.86
-0.86
-0.86
-0.86
-0.86
-0.85
Expression Profile of Segment S1156
Show/Hide
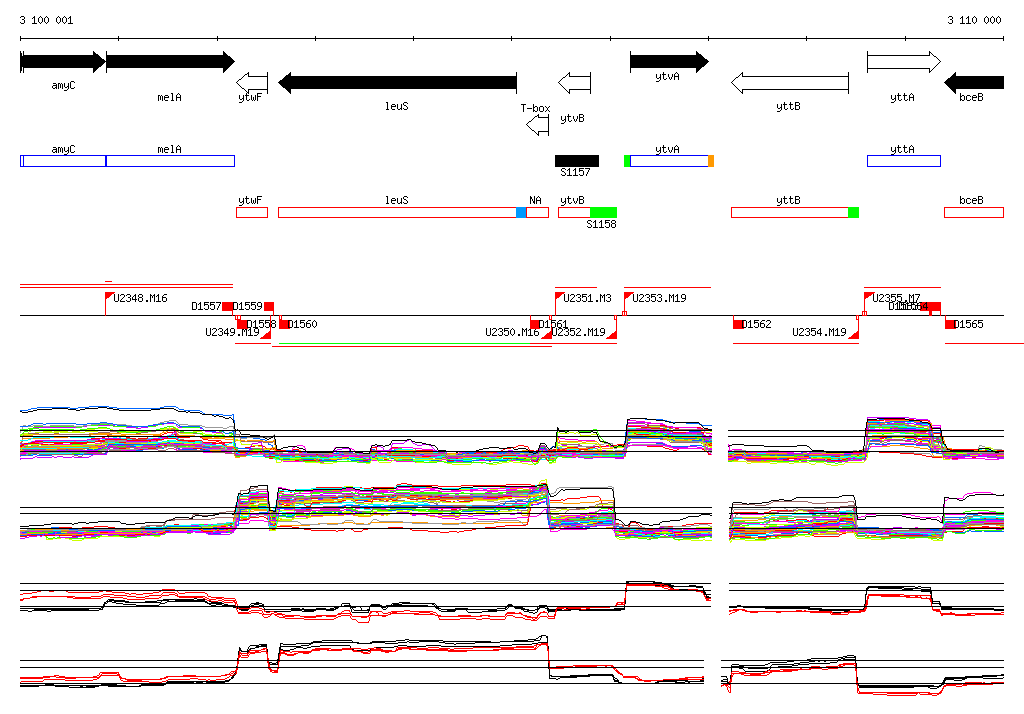
Genomic View of Gene/Segment S1156
Show/Hide
(Legend)
Browse Genome Context