| Start Page |
|
 |
| Start Page |
|
|
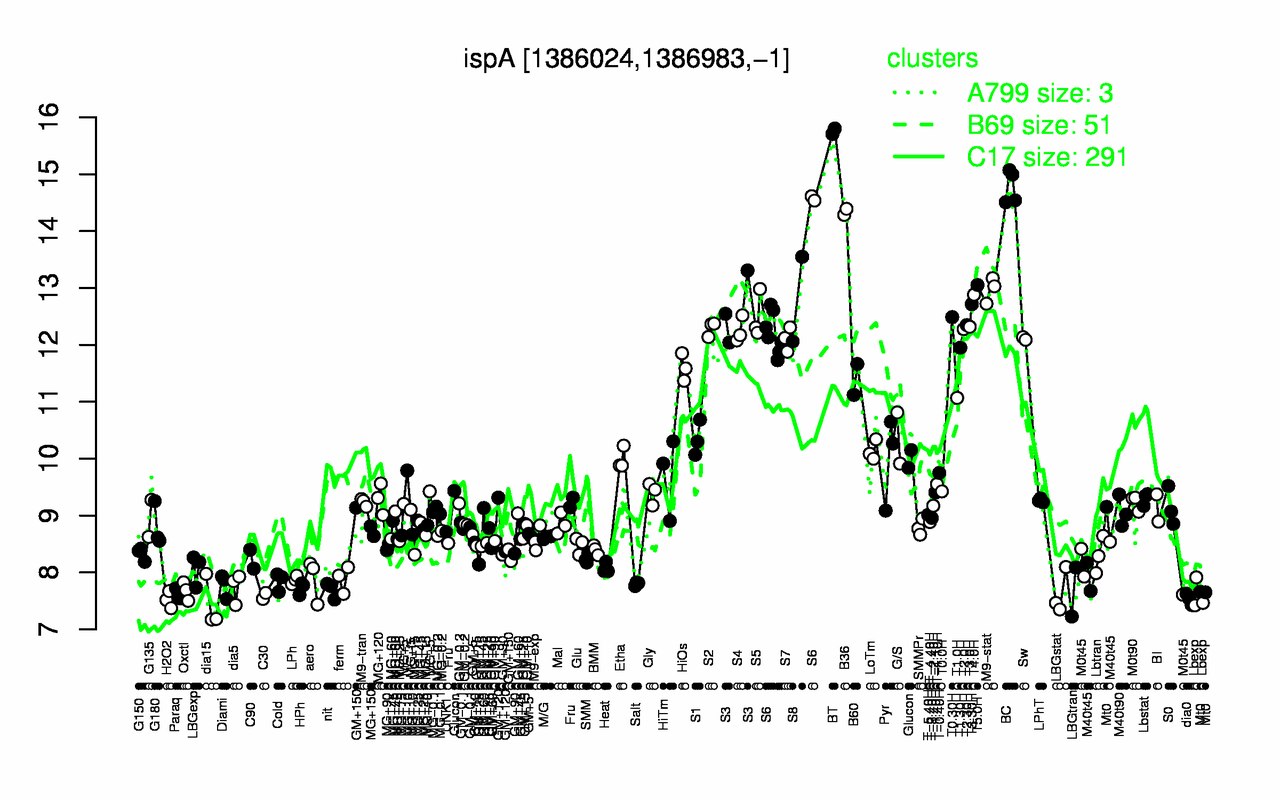
| BT | BC | B36 | T5.0H | M9-stat | T4.0H | S8 | S6 | T3.30H | S3 |
| 15.8 | 14.8 | 14.3 | 13.1 | 13 | 12.9 | 12.8 | 12.7 | 12.7 | 12.6 |
| dia15 | H2O2 | dia0 | C30 | Lbexp | Paraq | LBGstat | LBGtran | Oxctl | nit |
| 7.44 | 7.52 | 7.53 | 7.59 | 7.6 | 7.63 | 7.64 | 7.66 | 7.67 | 7.7 |