B. subtilis Expression Data Browser
Start Page
B. subtilis Expression Data Browser
Gene/Segment:
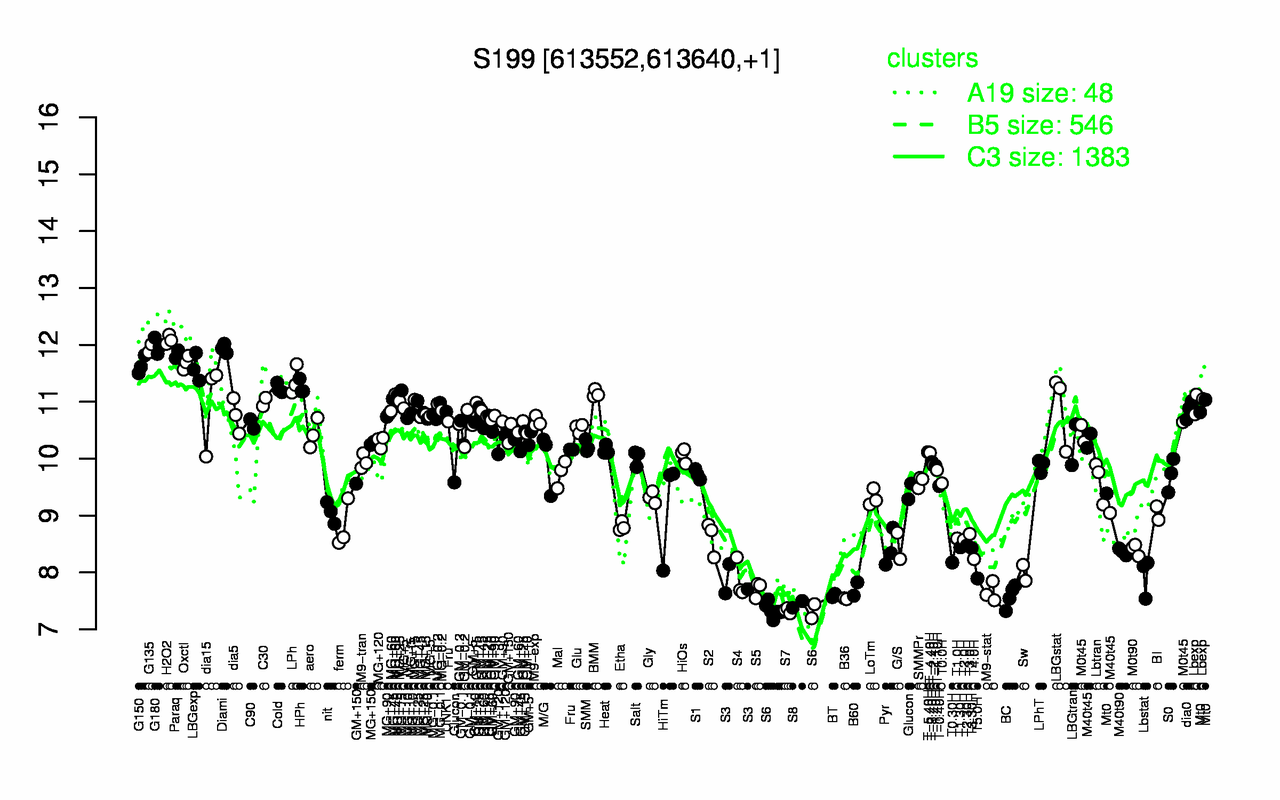
S199
Locus Tag:
new_613552_613640
Details about S199
Show/Hide
Highest Expression Conditions
H2O2
G180
G135
Diami
Paraq
Oxctl
G150
LBGexp
LPh
HPh
12.1
12
11.9
11.9
11.8
11.7
11.6
11.6
11.4
11.3
Lowest Expression Conditions
S6
S7
S8
B36
BC
BT
M9-stat
S5
B60
S3
7.33
7.33
7.44
7.54
7.58
7.6
7.66
7.71
7.71
7.83
Most Positively Correlated Segments
ydgK
dgk
ydbJ
yybD
yjcD
S621
ydjC
dck
fabZ
ydjB
0.96
0.92
0.92
0.91
0.91
0.9
0.9
0.9
0.9
0.9
Most Negatively Correlated Segments
sigF
spoIIAB
spoIIAA
S725
S727
yobO
dacC
ctaF
yknU
ctaE
-0.91
-0.91
-0.9
-0.89
-0.87
-0.87
-0.86
-0.86
-0.85
-0.85
Expression Profile of Segment S199
Show/Hide
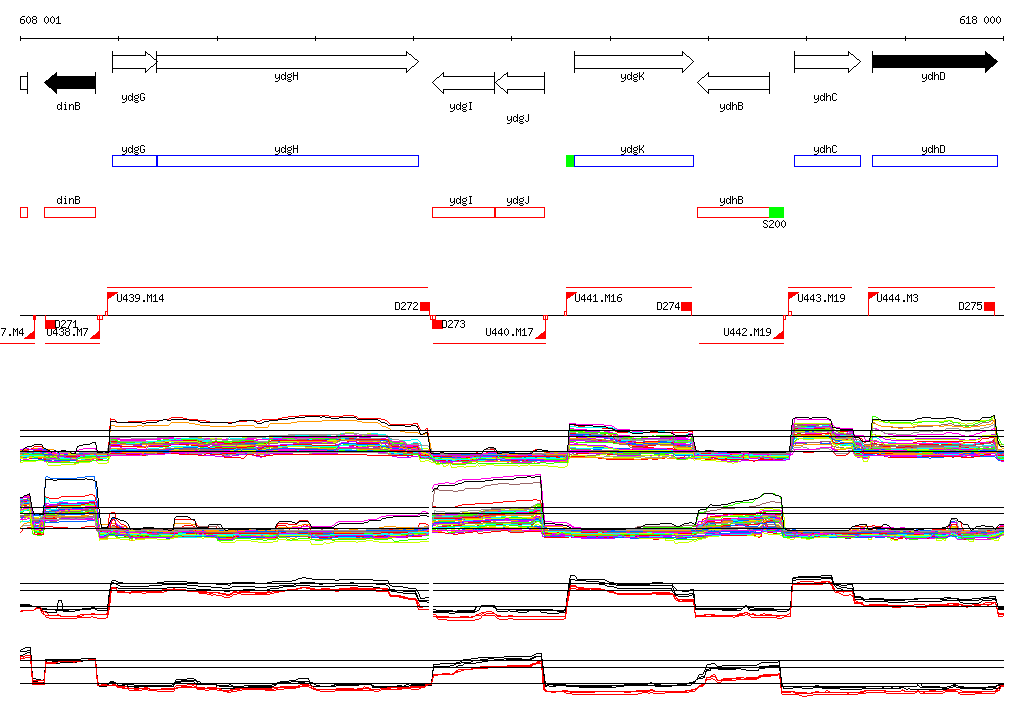
Genomic View of Gene/Segment S199
Show/Hide
(Legend)
Browse Genome Context