B. subtilis Expression Data Browser
Start Page
B. subtilis Expression Data Browser
Gene/Segment:
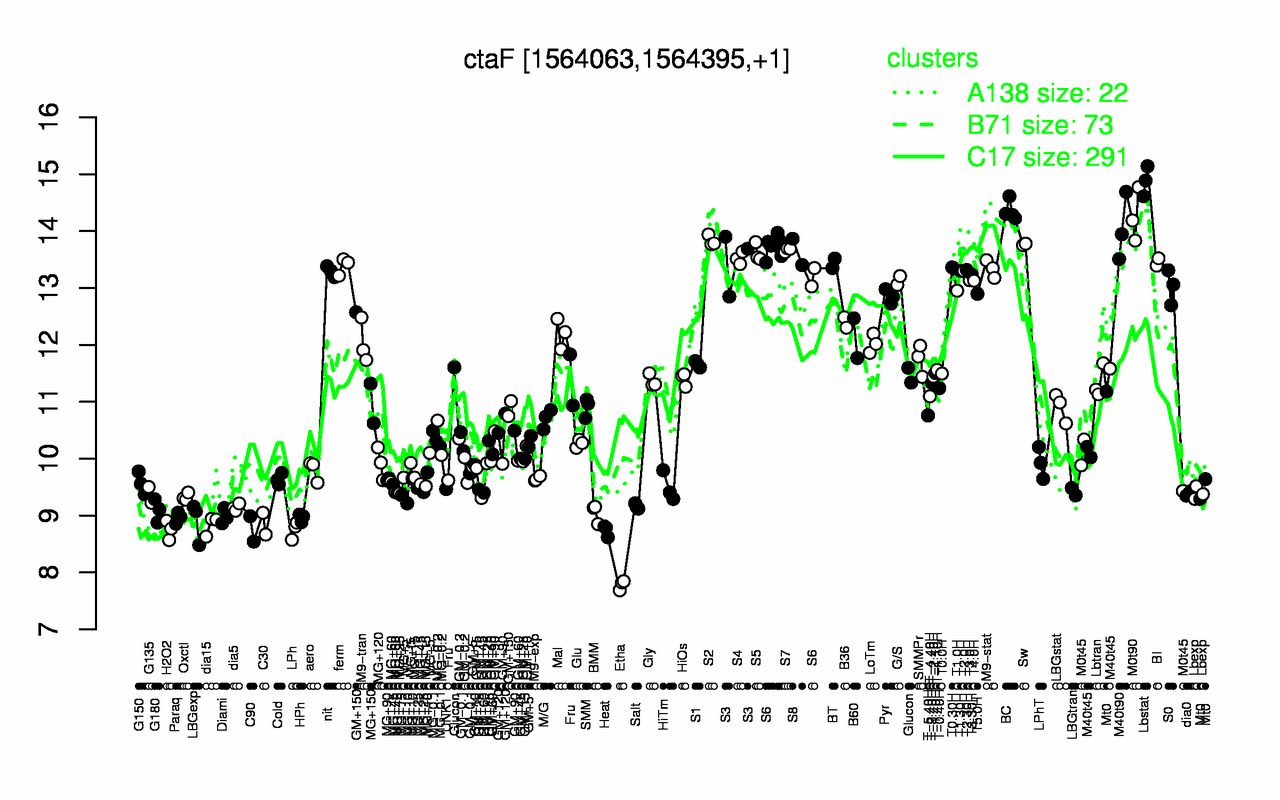
ctaF
Locus Tag:
BSU14920
Details about ctaF
Show/Hide
Highest Expression Conditions
Lbstat
BC
M0t90
M40t90
S2
Sw
S7
S8
S5
S6
14.9
14.4
14.3
14
13.8
13.8
13.7
13.6
13.6
13.6
Lowest Expression Conditions
Etha
Heat
H2O2
LPh
C90
dia15
C30
LBGexp
Paraq
HPh
7.78
8.74
8.75
8.75
8.77
8.83
8.86
8.91
8.96
8.96
Most Positively Correlated Segments
ctaE
ctaG
ctaD
ctaC
cccA
S544
qcrC
qcrB
qcrA
yobO
1
0.99
0.99
0.98
0.94
0.93
0.93
0.91
0.91
0.88
Most Negatively Correlated Segments
S199
ykaA
nrnA
S304
yvbW
ydgK
ycgR
ptsI
ycgQ
moaB
-0.86
-0.84
-0.83
-0.83
-0.82
-0.82
-0.82
-0.81
-0.81
-0.8
Expression Profile of Segment ctaF
Show/Hide
Annotation of Gene ctaF
Show/Hide
function
16.10: Respire
inference
ab initio prediction:AMIGene:2.0
codon_start
1
EC_number
1.9.3.1
transl_table
11
note
Evidence 1a: Function experimentally demonstrated in the studied strain; PubMedId: 1847686; Product type e : enzyme
db_xref
GI:2633863
product
cytochrome caa3 oxidase (subunit IV)
protein_id
CAB13365.1
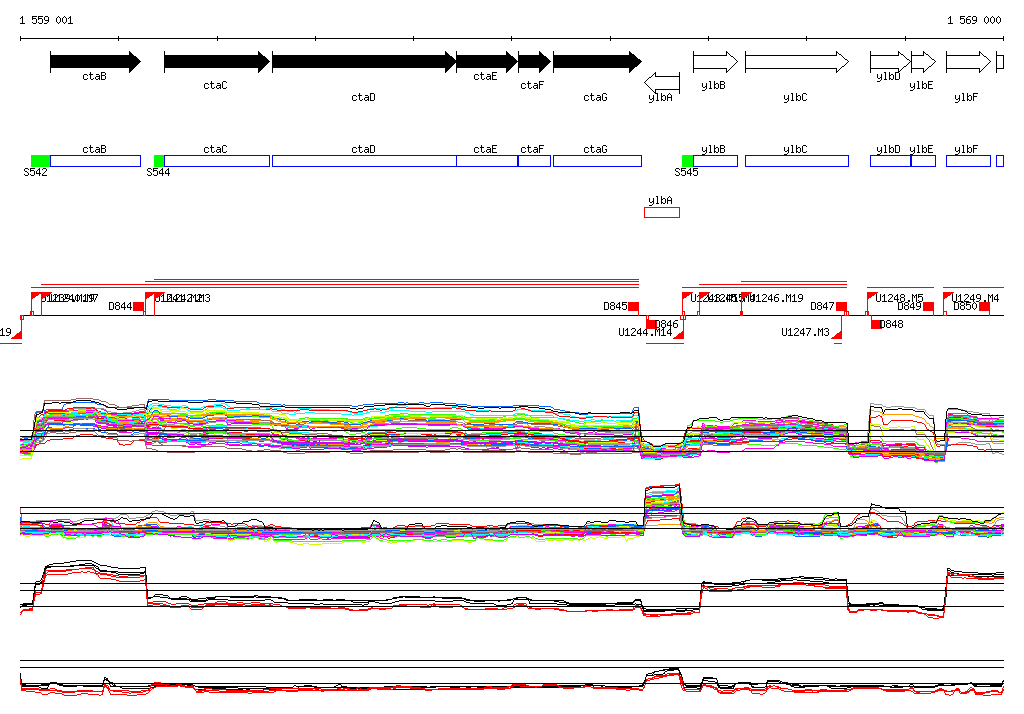
Genomic View of Gene/Segment ctaF
Show/Hide
(Legend)
Browse Genome Context