| Start Page |
|
 |
| Start Page |
|
|
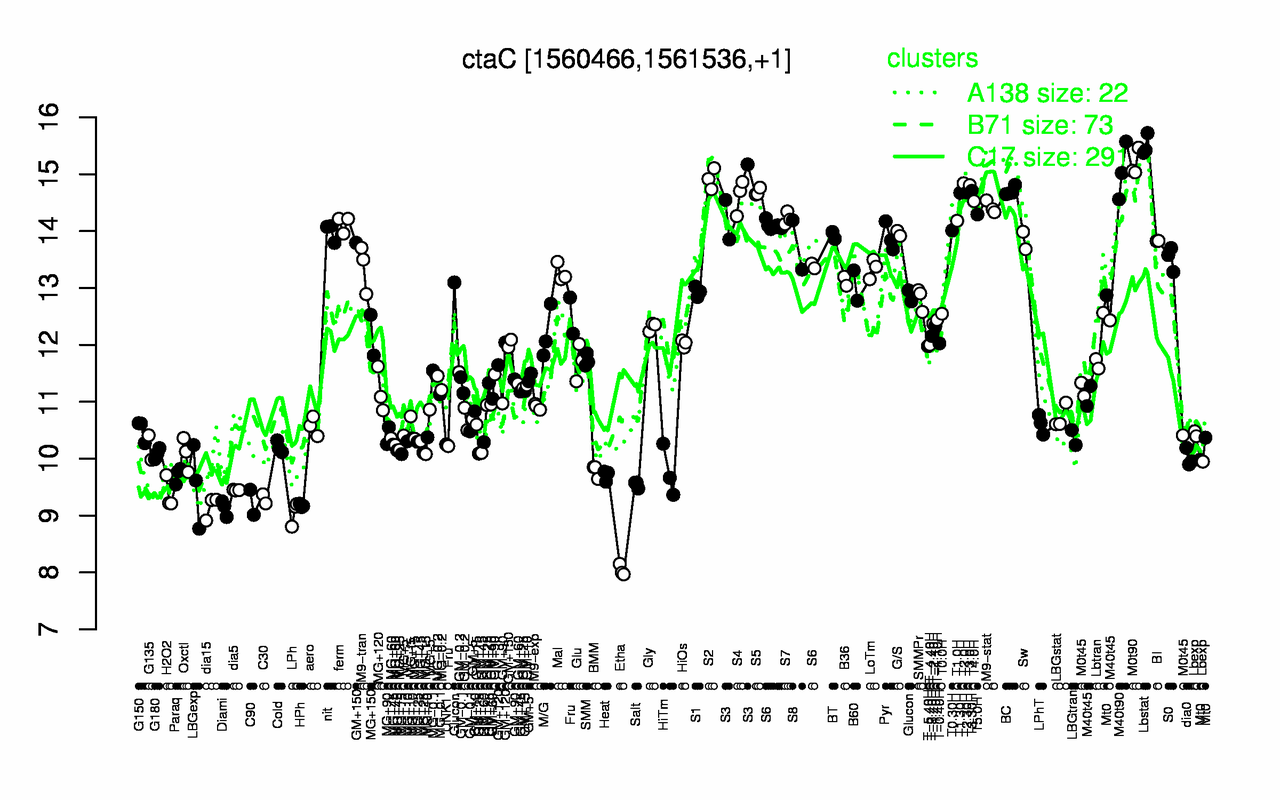
| Lbstat | M0t90 | M40t90 | S2 | T2.0H | T3.0H | T3.30H | BC | S5 | T2.30H |
| 15.5 | 15.2 | 15.1 | 14.9 | 14.8 | 14.8 | 14.7 | 14.7 | 14.7 | 14.7 |
| Etha | LPh | Diami | dia15 | HPh | C90 | C30 | H2O2 | dia5 | LBGexp |
| 8.04 | 9.05 | 9.13 | 9.15 | 9.18 | 9.23 | 9.29 | 9.38 | 9.45 | 9.54 |