| Start Page |
|
 |
| Start Page |
|
|
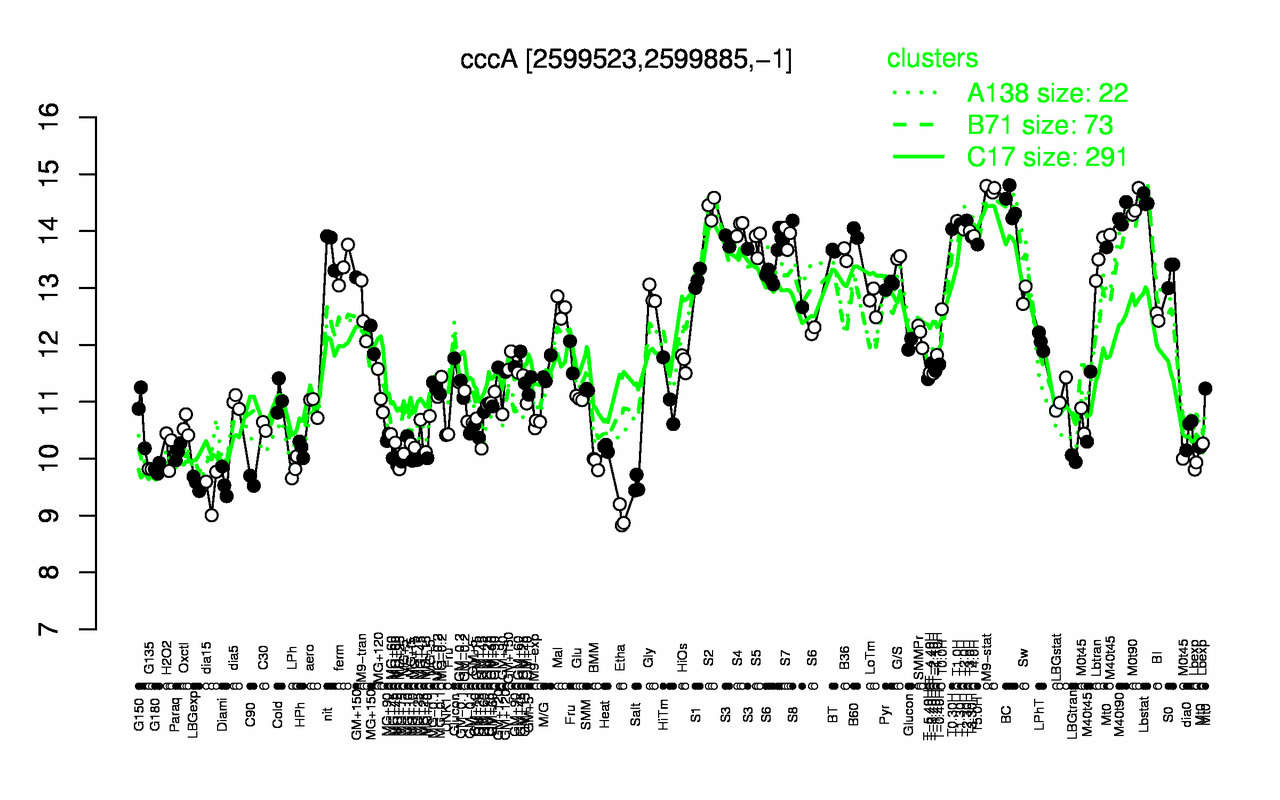
| M9-stat | Lbstat | BC | M0t90 | S2 | M40t90 | T2.30H | T1.0H | T1.30H | S4 |
| 14.7 | 14.5 | 14.5 | 14.5 | 14.4 | 14.3 | 14.2 | 14.2 | 14.1 | 14.1 |
| Etha | dia15 | Salt | LBGexp | Diami | C90 | G135 | G180 | LPh | BMM |
| 8.97 | 9.46 | 9.54 | 9.57 | 9.58 | 9.61 | 9.82 | 9.83 | 9.84 | 9.92 |