| Start Page |
|
 |
| Start Page |
|
|
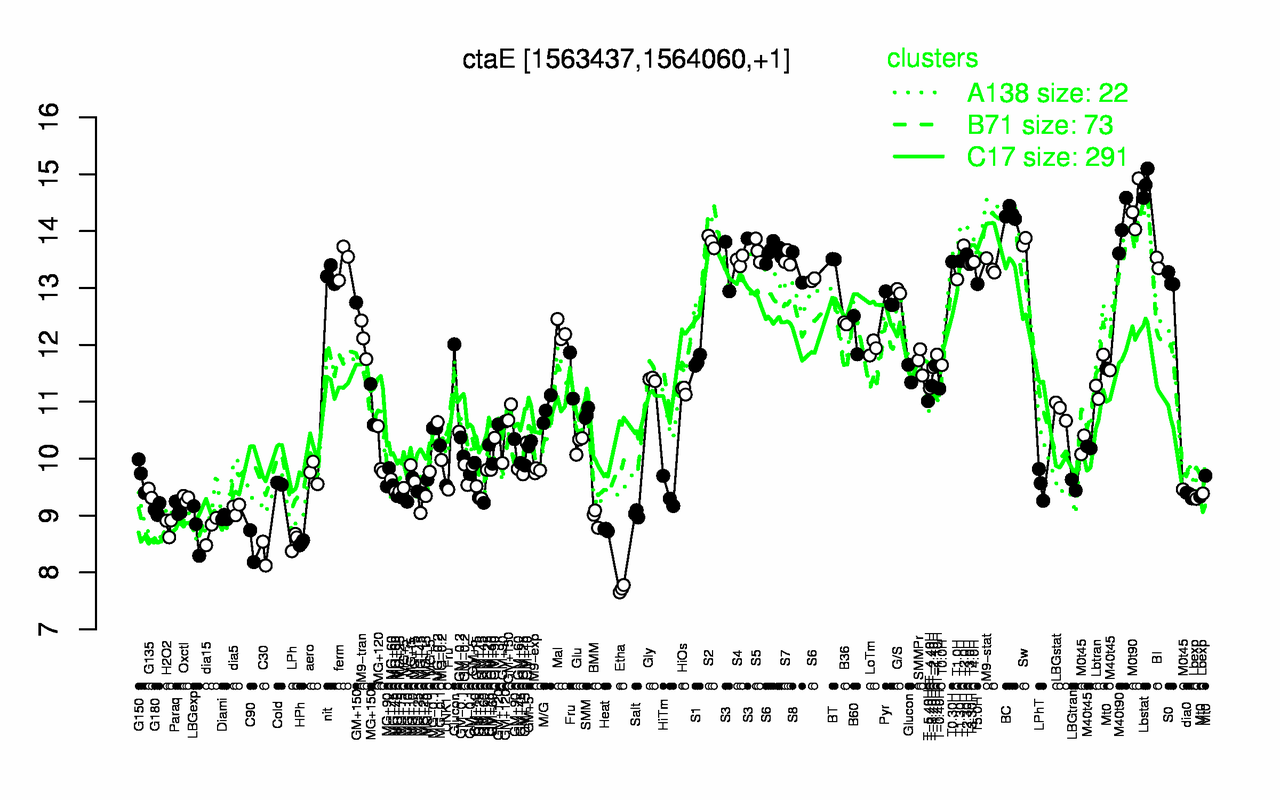
| Lbstat | M0t90 | BC | M40t90 | Sw | S2 | T2.0H | S5 | T2.30H | S3 |
| 14.8 | 14.4 | 14.3 | 14.1 | 13.8 | 13.8 | 13.7 | 13.7 | 13.6 | 13.5 |
| Etha | C30 | C90 | HPh | LPh | Heat | dia15 | LBGexp | H2O2 | Diami |
| 7.71 | 8.33 | 8.46 | 8.52 | 8.56 | 8.75 | 8.76 | 8.77 | 8.81 | 8.96 |