| Start Page |
|
 |
| Start Page |
|
|
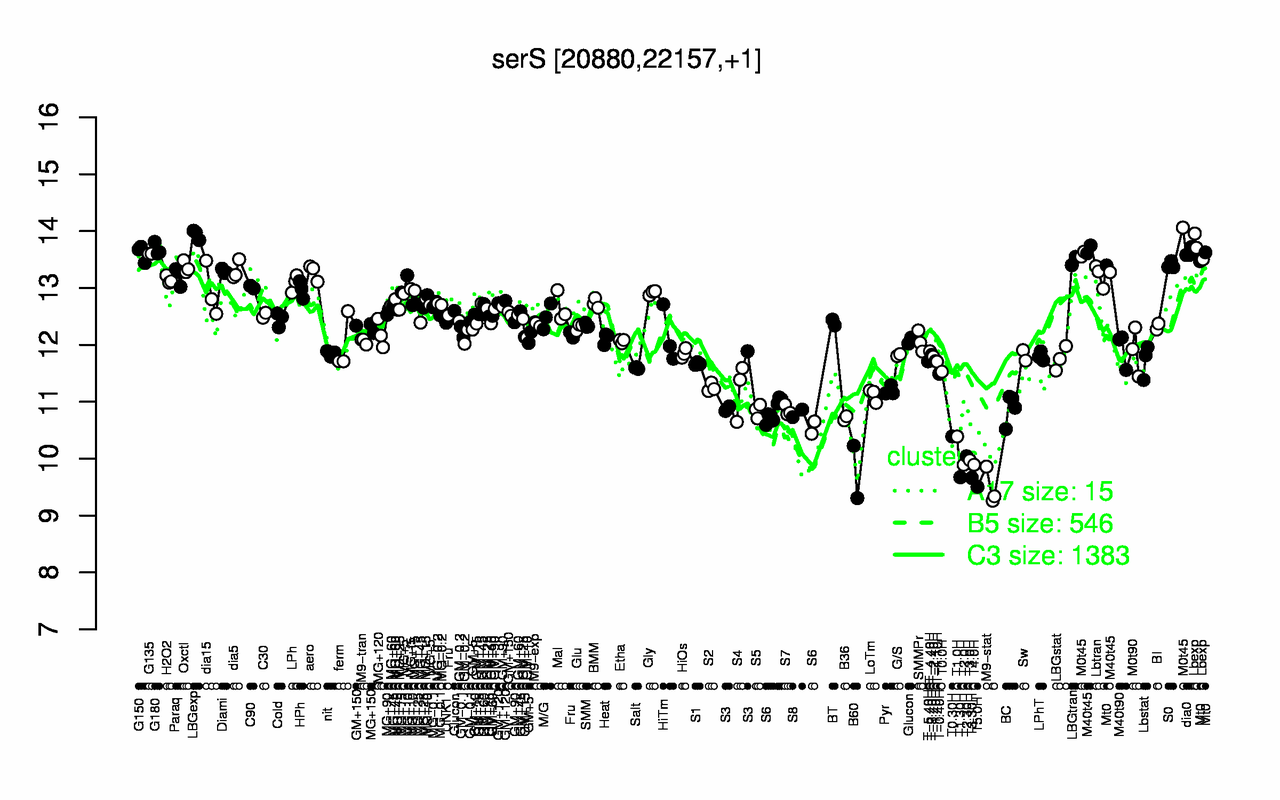
| LBGexp | M0t45 | Lbexp | G180 | dia0 | G150 | G135 | M40t45 | Mt0 | LBGtran |
| 13.9 | 13.8 | 13.7 | 13.7 | 13.6 | 13.6 | 13.6 | 13.5 | 13.5 | 13.5 |
| M9-stat | T5.0H | T3.30H | T1.30H | B60 | T2.0H | T4.0H | T3.0H | T2.30H | T0.30H |
| 9.49 | 9.5 | 9.66 | 9.67 | 9.77 | 9.89 | 9.89 | 9.97 | 10 | 10.4 |