| Start Page |
|
 |
| Start Page |
|
|
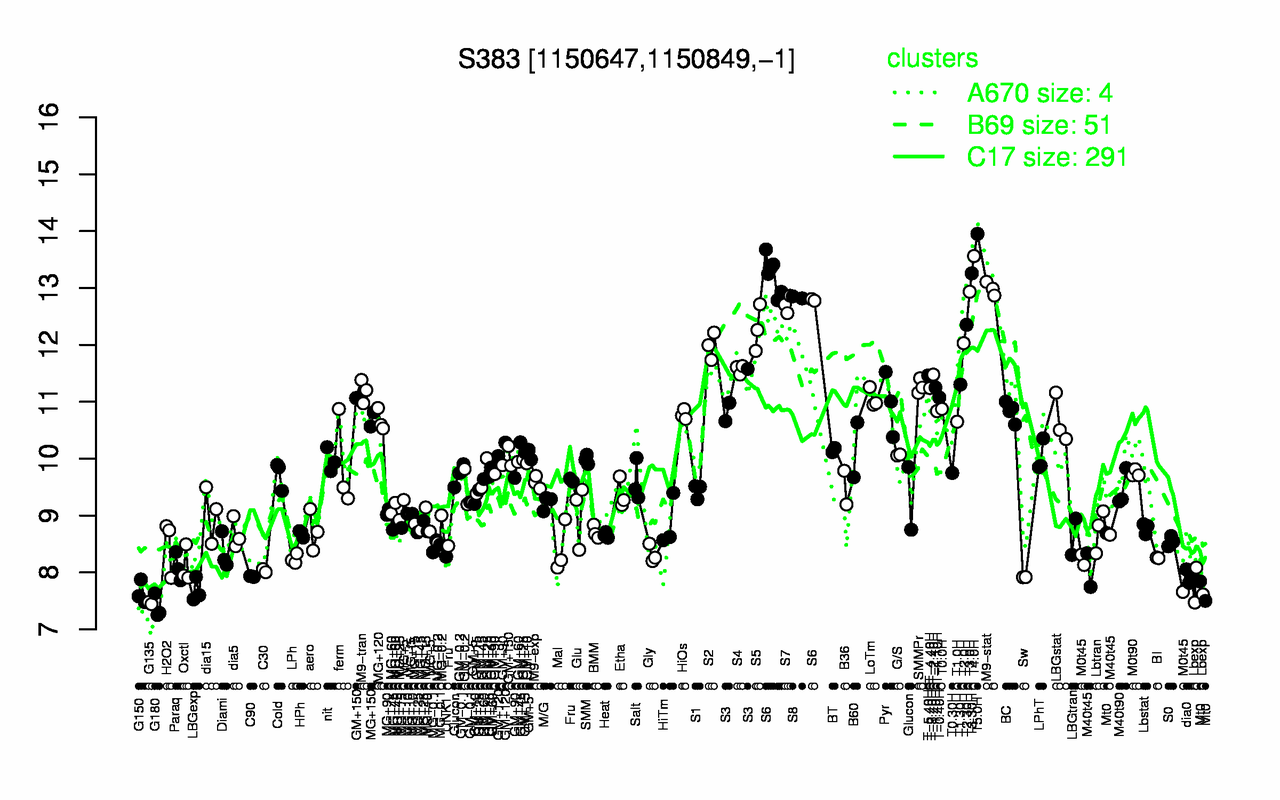
| T5.0H | T4.0H | T3.30H | S6 | M9-stat | T3.0H | S8 | S7 | T2.30H | S5 |
| 14 | 13.6 | 13.3 | 13.1 | 13 | 12.9 | 12.8 | 12.7 | 12.4 | 12.3 |
| G180 | G135 | G150 | LBGexp | Lbexp | Sw | C90 | dia0 | Mt0 | C30 |
| 7.39 | 7.46 | 7.64 | 7.68 | 7.72 | 7.92 | 7.93 | 7.93 | 8.01 | 8.03 |