| Start Page |
|
 |
| Start Page |
|
|
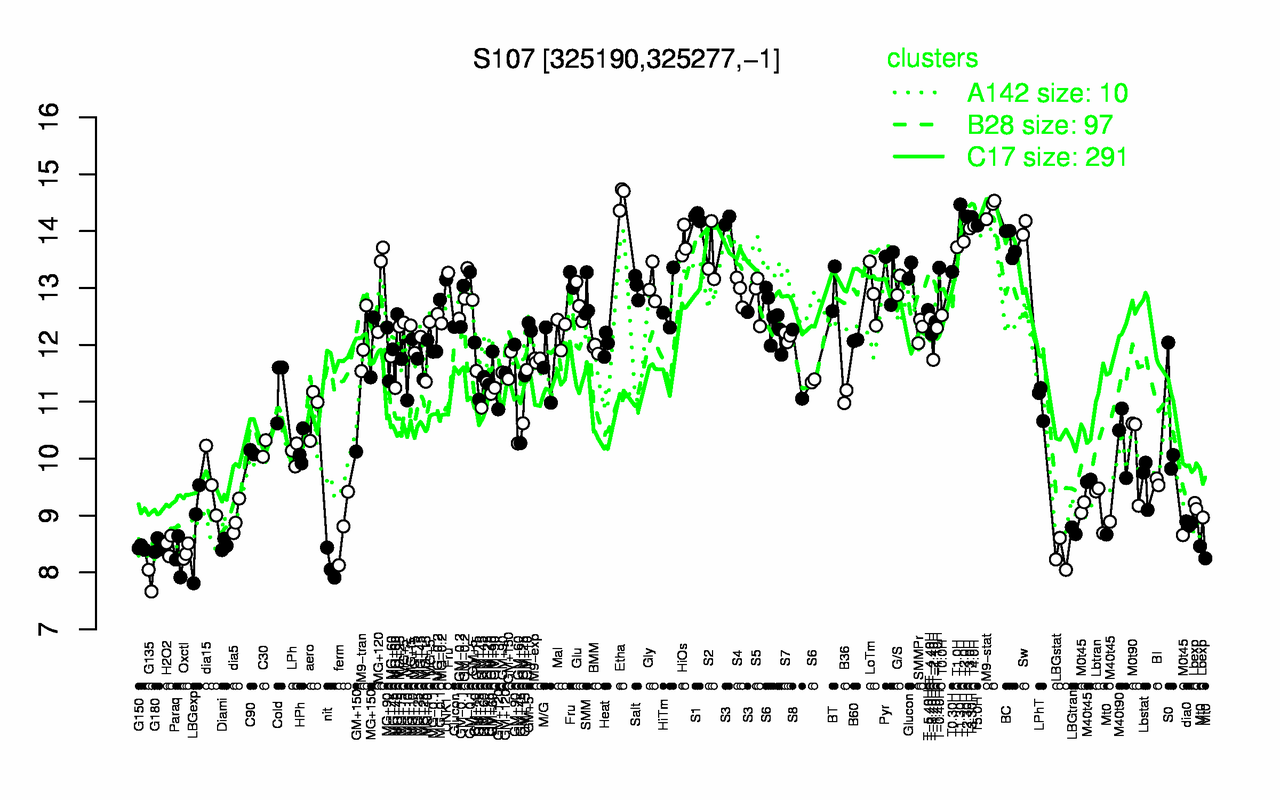
| Etha | T1.30H | M9-stat | T2.30H | S1 | T3.30H | T5.0H | T4.0H | Sw | T3.0H |
| 14.6 | 14.5 | 14.4 | 14.3 | 14.3 | 14.2 | 14.1 | 14.1 | 14.1 | 14 |
| G135 | nit | Paraq | LBGstat | Oxctl | G150 | G180 | Mt0 | H2O2 | Diami |
| 7.86 | 8.13 | 8.26 | 8.29 | 8.36 | 8.43 | 8.45 | 8.46 | 8.48 | 8.49 |