| Start Page |
|
 |
| Start Page |
|
|
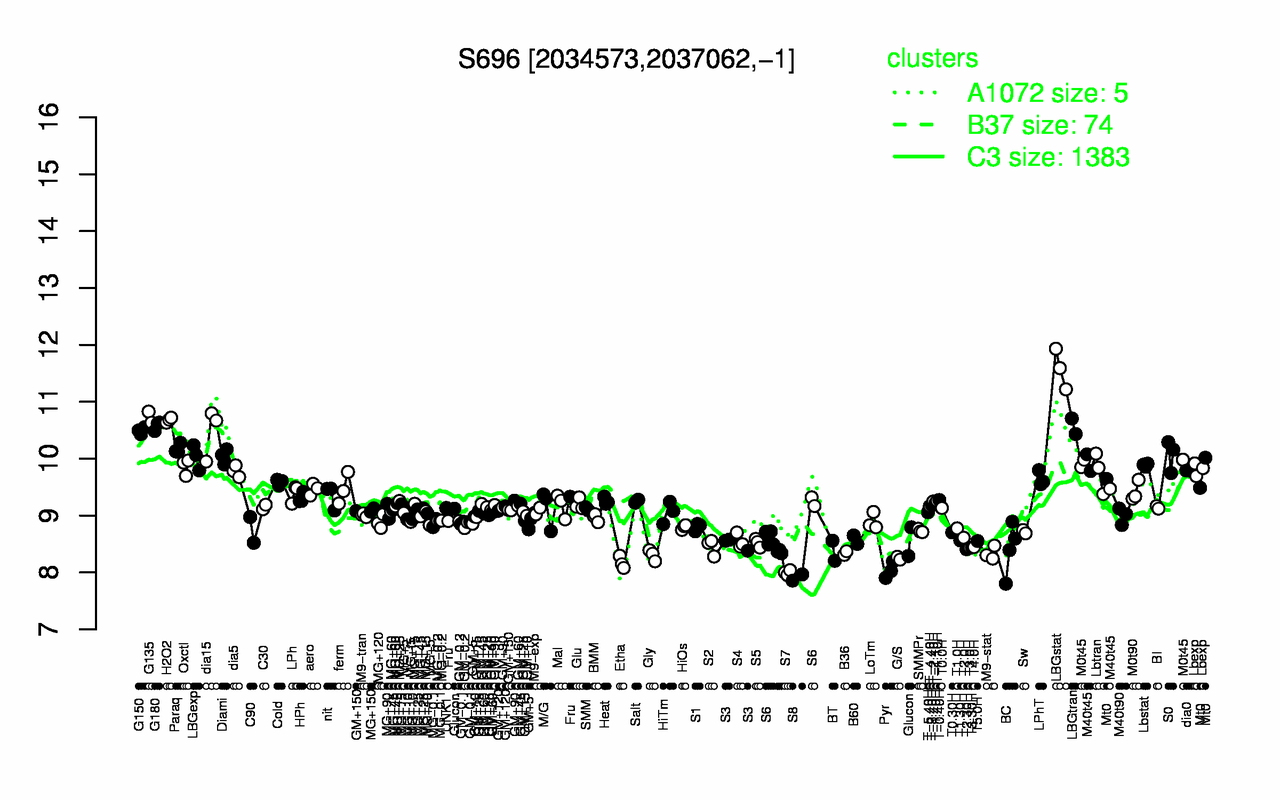
| LBGstat | G135 | H2O2 | G180 | LBGtran | G150 | dia15 | Paraq | S0 | Diami |
| 11.6 | 10.7 | 10.7 | 10.6 | 10.6 | 10.5 | 10.5 | 10.2 | 10.1 | 10 |
| S8 | S7 | Pyr | Etha | G/S | Gly | M9-stat | B36 | BT | T2.30H |
| 7.91 | 8 | 8.04 | 8.17 | 8.25 | 8.31 | 8.34 | 8.34 | 8.38 | 8.41 |