| Start Page |
|
 |
| Start Page |
|
|
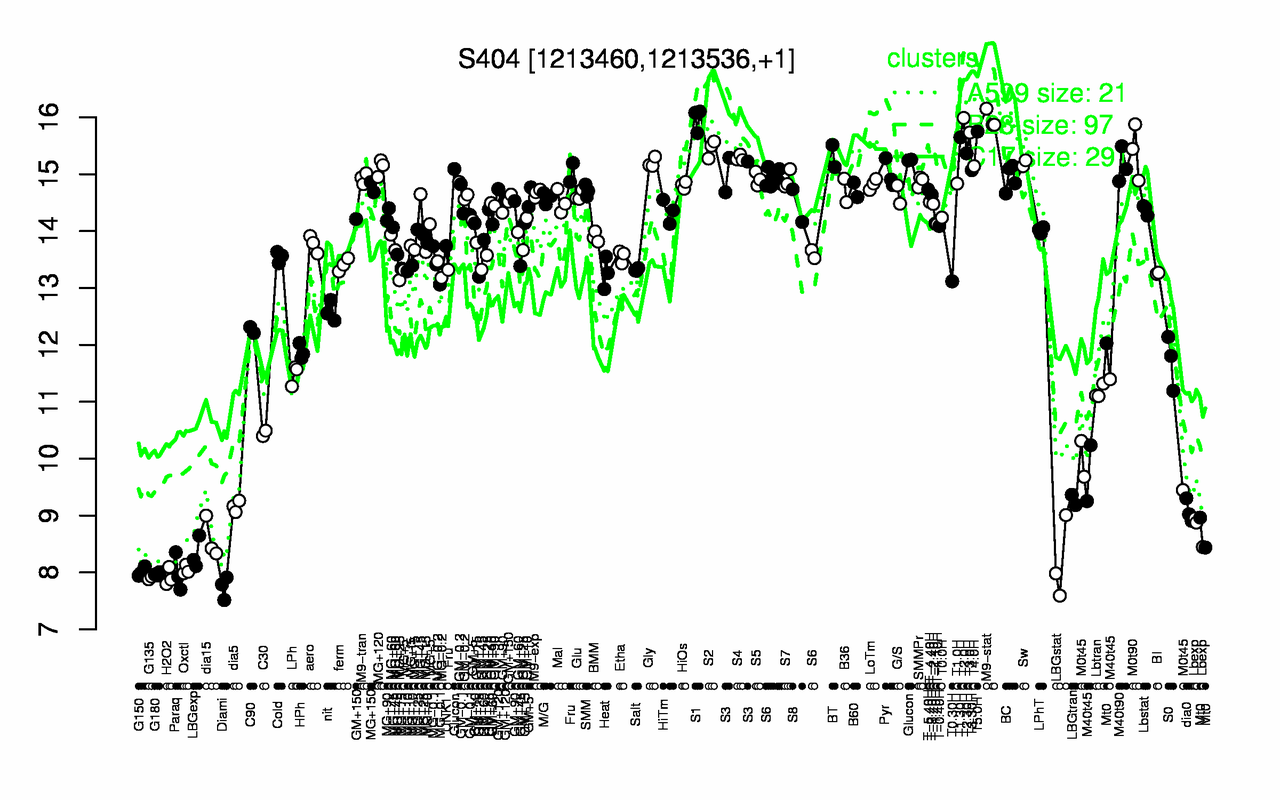
| T2.0H | S1 | M9-stat | T5.0H | T3.0H | T1.30H | S2 | M0t90 | T2.30H | BT |
| 16 | 16 | 16 | 15.8 | 15.7 | 15.6 | 15.4 | 15.4 | 15.4 | 15.3 |
| Diami | G135 | H2O2 | G180 | Paraq | G150 | Oxctl | LBGstat | LBGexp | dia15 |
| 7.74 | 7.9 | 7.92 | 7.97 | 7.99 | 8.01 | 8.04 | 8.19 | 8.33 | 8.58 |