| Start Page |
|
 |
| Start Page |
|
|
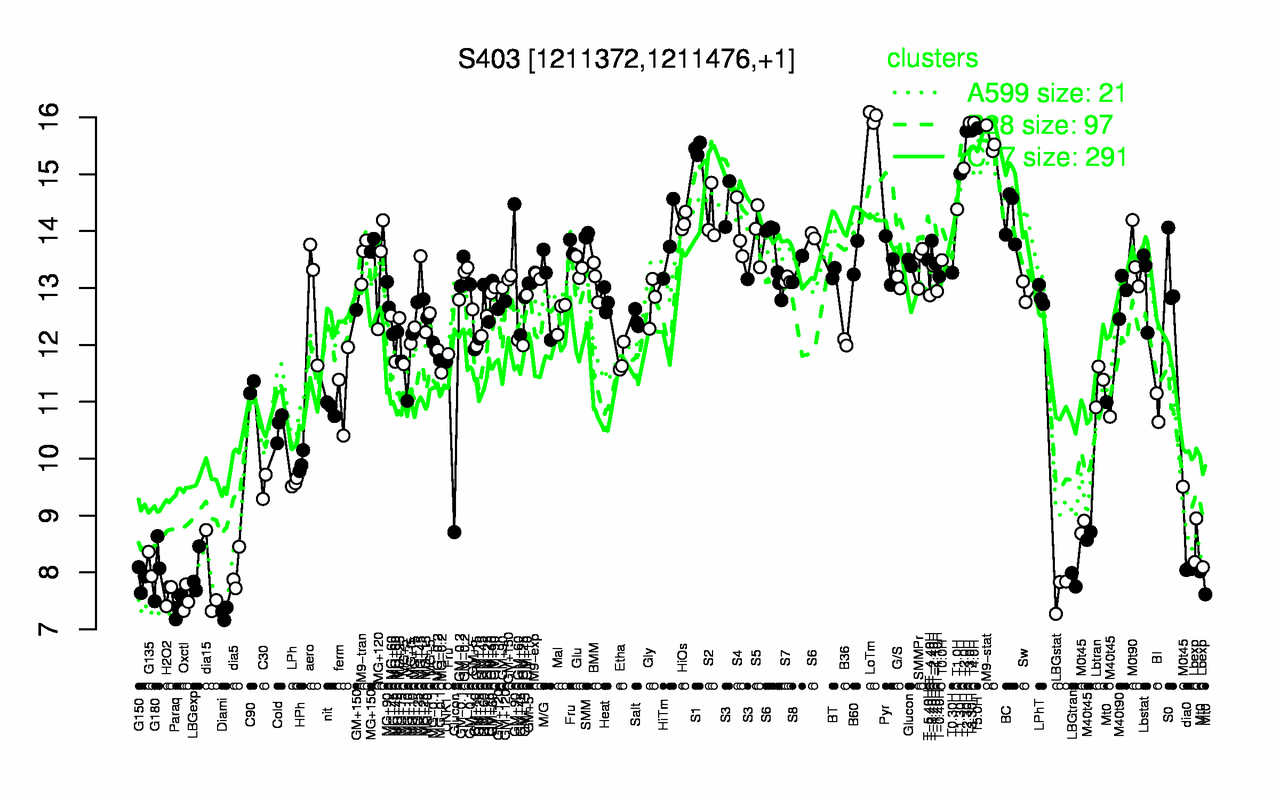
| LoTm | T4.0H | T3.0H | T5.0H | T3.30H | T2.30H | M9-stat | S1 | T2.0H | T1.30H |
| 16 | 15.9 | 15.9 | 15.8 | 15.8 | 15.8 | 15.6 | 15.4 | 15.1 | 15 |
| Diami | Paraq | Oxctl | H2O2 | LBGstat | dia15 | LBGtran | G150 | LBGexp | dia5 |
| 7.28 | 7.39 | 7.53 | 7.63 | 7.65 | 7.86 | 7.87 | 7.89 | 7.99 | 8.02 |