| Start Page |
|
 |
| Start Page |
|
|
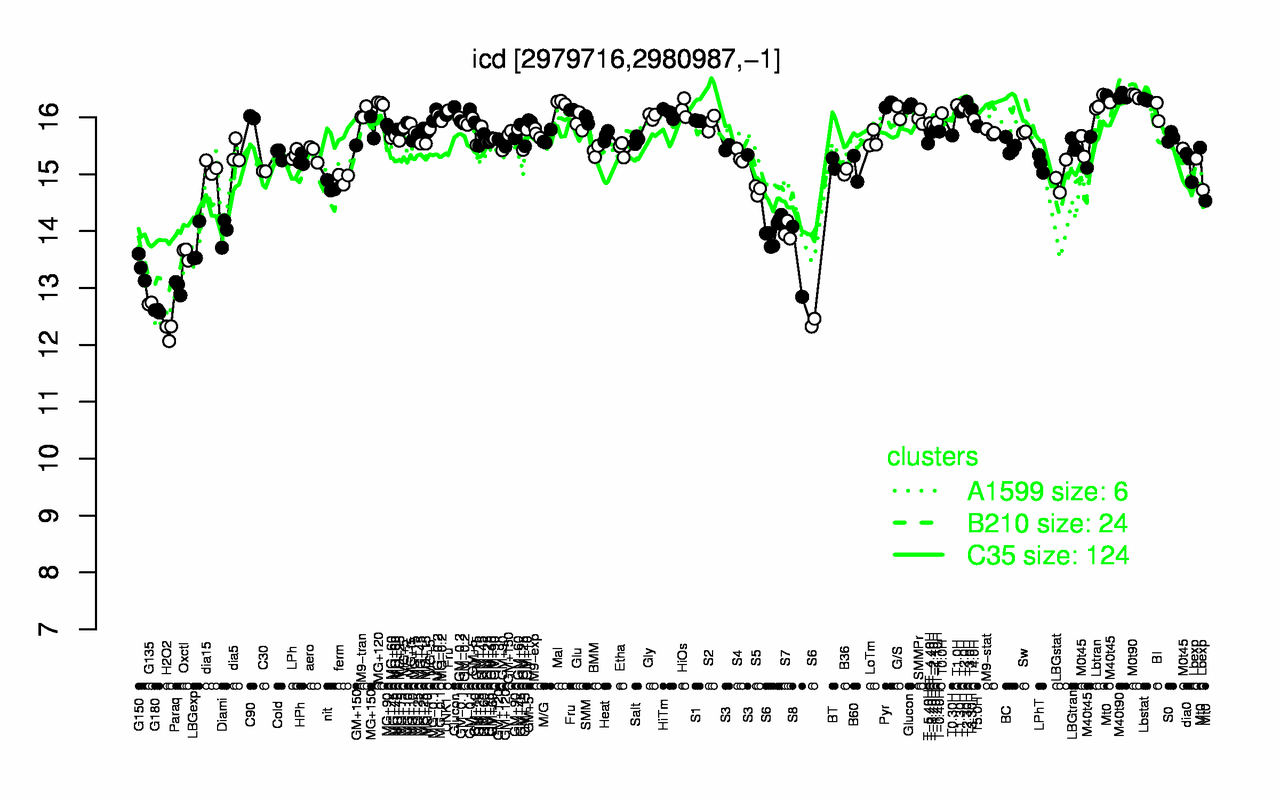
| M0t90 | M40t90 | Lbstat | T2.30H | Mal | MG+120 | Lbtran | Pyr | T1.0H | Glucon |
| 16.4 | 16.4 | 16.3 | 16.3 | 16.3 | 16.2 | 16.2 | 16.2 | 16.2 | 16.2 |
| H2O2 | G180 | G135 | Paraq | G150 | S8 | Oxctl | S6 | LBGexp | Diami |
| 12.2 | 12.6 | 12.7 | 13 | 13.4 | 13.5 | 13.6 | 13.6 | 13.7 | 14 |