| Start Page |
|
 |
| Start Page |
|
|
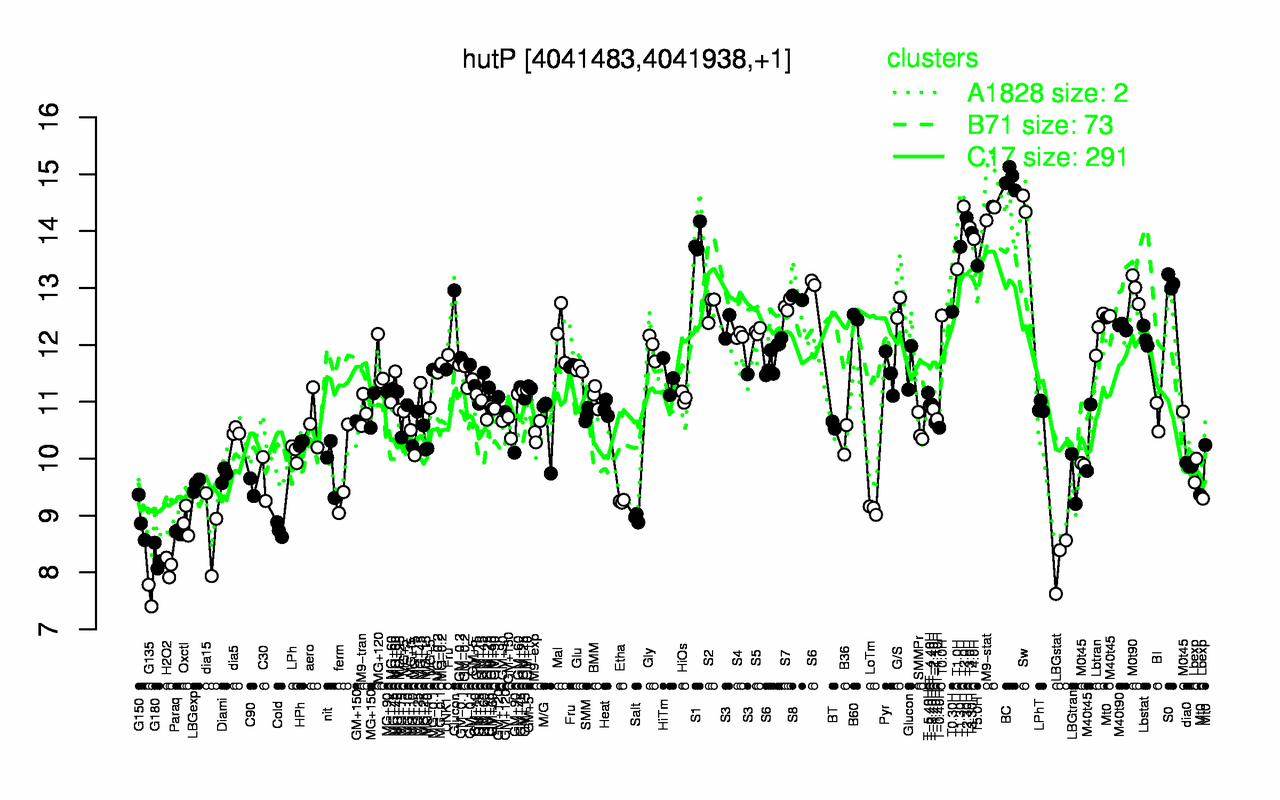
| BC | Sw | T2.0H | M9-stat | T2.30H | T3.0H | T3.30H | T4.0H | S1 | T1.30H |
| 14.9 | 14.5 | 14.4 | 14.3 | 14.2 | 14.1 | 14 | 13.9 | 13.9 | 13.7 |
| G135 | H2O2 | LBGstat | G180 | Paraq | Cold | dia15 | Oxctl | G150 | Salt |
| 7.59 | 8.1 | 8.19 | 8.26 | 8.71 | 8.75 | 8.76 | 8.89 | 8.93 | 8.96 |