| Start Page |
|
 |
| Start Page |
|
|
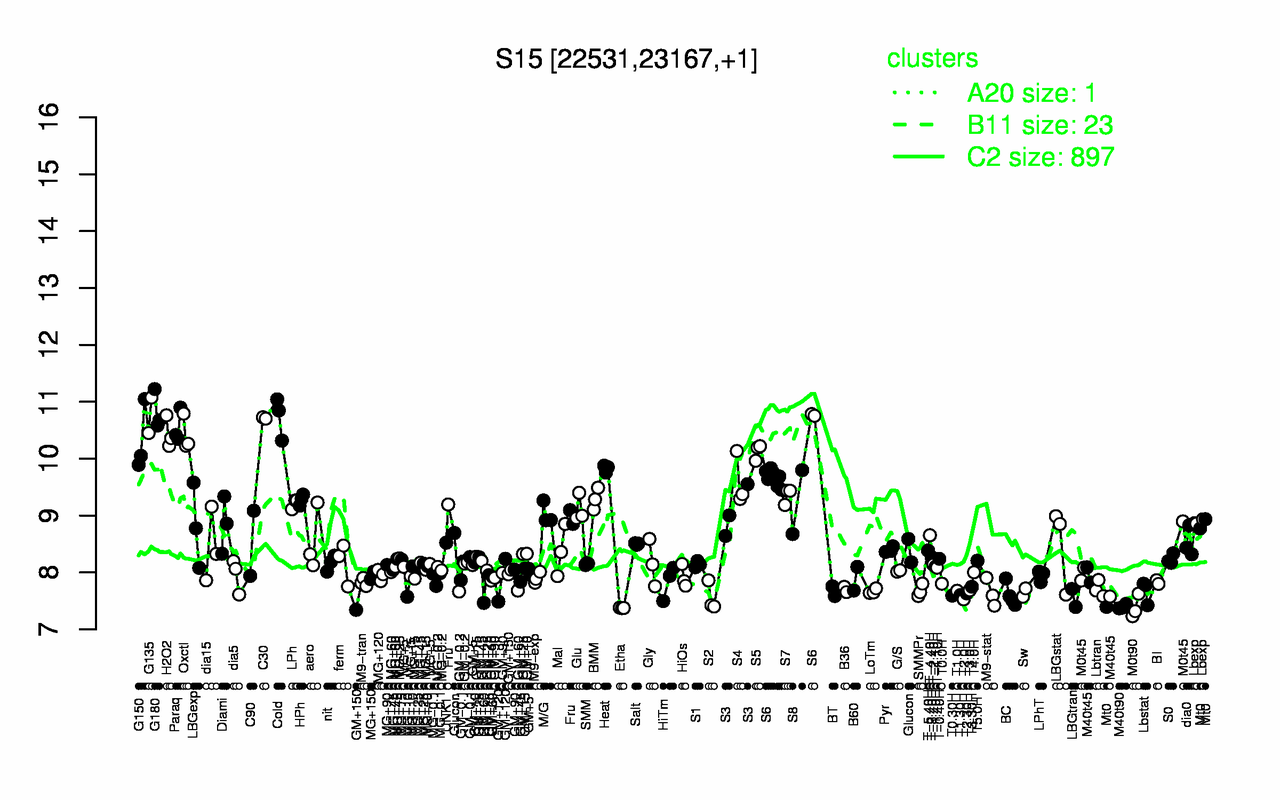
| G180 | G135 | Cold | C30 | Paraq | H2O2 | Oxctl | G150 | S5 | S6 |
| 10.8 | 10.8 | 10.7 | 10.7 | 10.6 | 10.4 | 10.4 | 10.3 | 10.1 | 9.91 |
| Etha | M0t90 | M40t90 | T2.0H | LBGtran | S2 | T0.30H | BC | T1.30H | T2.30H |
| 7.38 | 7.39 | 7.4 | 7.53 | 7.55 | 7.56 | 7.59 | 7.6 | 7.6 | 7.63 |