| Start Page |
|
 |
| Start Page |
|
|
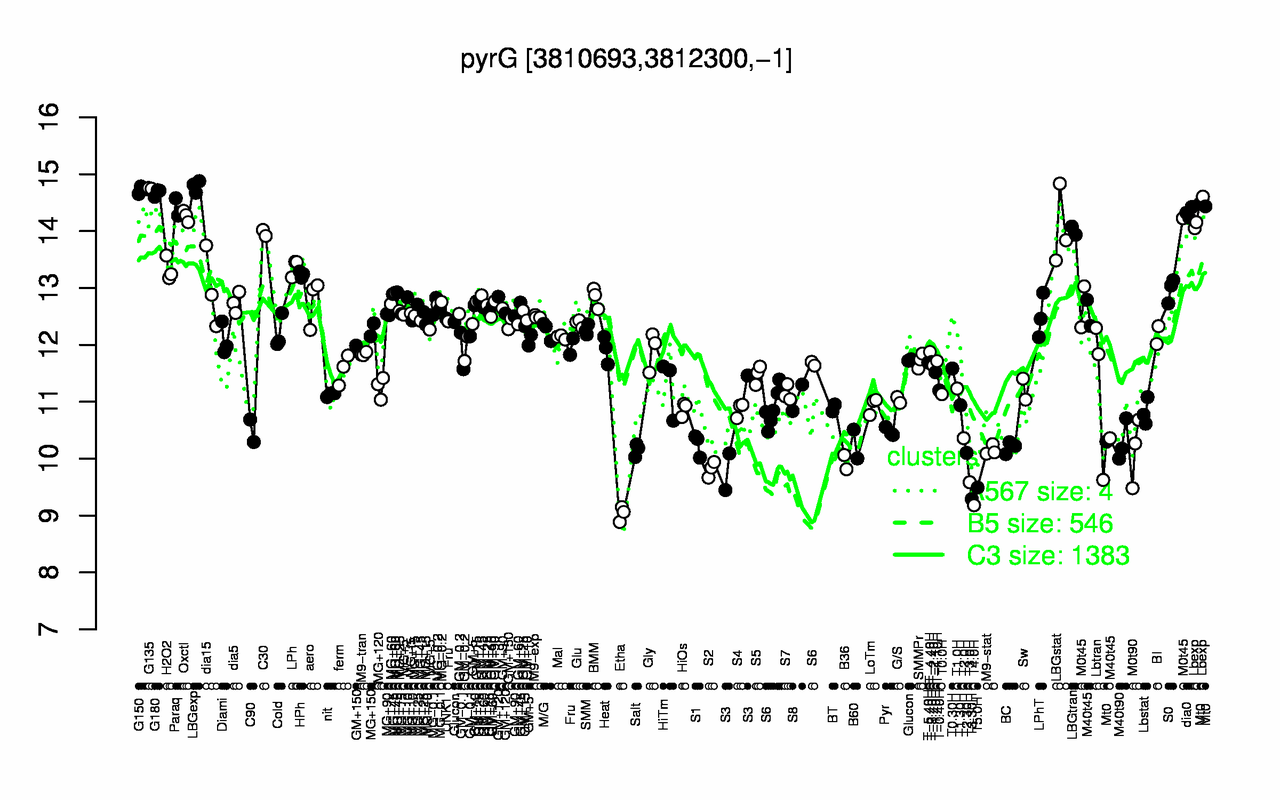
| LBGexp | G135 | G150 | G180 | Paraq | dia0 | Lbexp | Oxctl | LBGstat | LBGtran |
| 14.8 | 14.8 | 14.7 | 14.7 | 14.4 | 14.3 | 14.3 | 14.3 | 14.1 | 14 |
| Etha | T4.0H | T3.30H | T5.0H | T3.0H | S2 | B36 | T2.30H | M0t90 | M9-stat |
| 9.03 | 9.18 | 9.29 | 9.49 | 9.59 | 9.82 | 9.94 | 10.1 | 10.1 | 10.2 |