| Start Page |
|
 |
| Start Page |
|
|
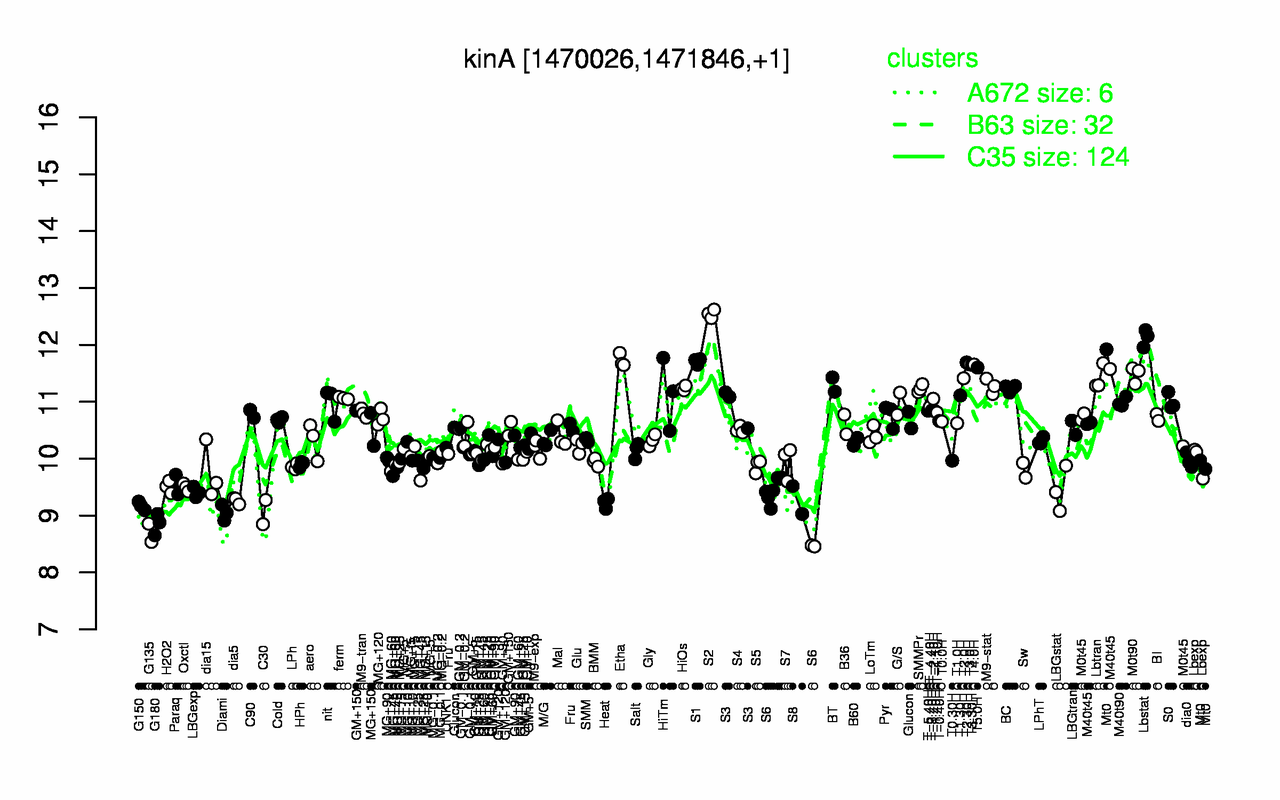
| S2 | Lbstat | Etha | S1 | T2.30H | T3.0H | T4.0H | T3.30H | T5.0H | M0t90 |
| 12.5 | 12.1 | 11.7 | 11.7 | 11.7 | 11.7 | 11.7 | 11.7 | 11.6 | 11.5 |
| G135 | G180 | Diami | C30 | G150 | Heat | S6 | dia5 | S8 | LBGexp |
| 8.7 | 8.85 | 9.05 | 9.06 | 9.17 | 9.22 | 9.25 | 9.27 | 9.27 | 9.41 |