B. subtilis Expression Data Browser
Start Page
B. subtilis Expression Data Browser
Gene/Segment:
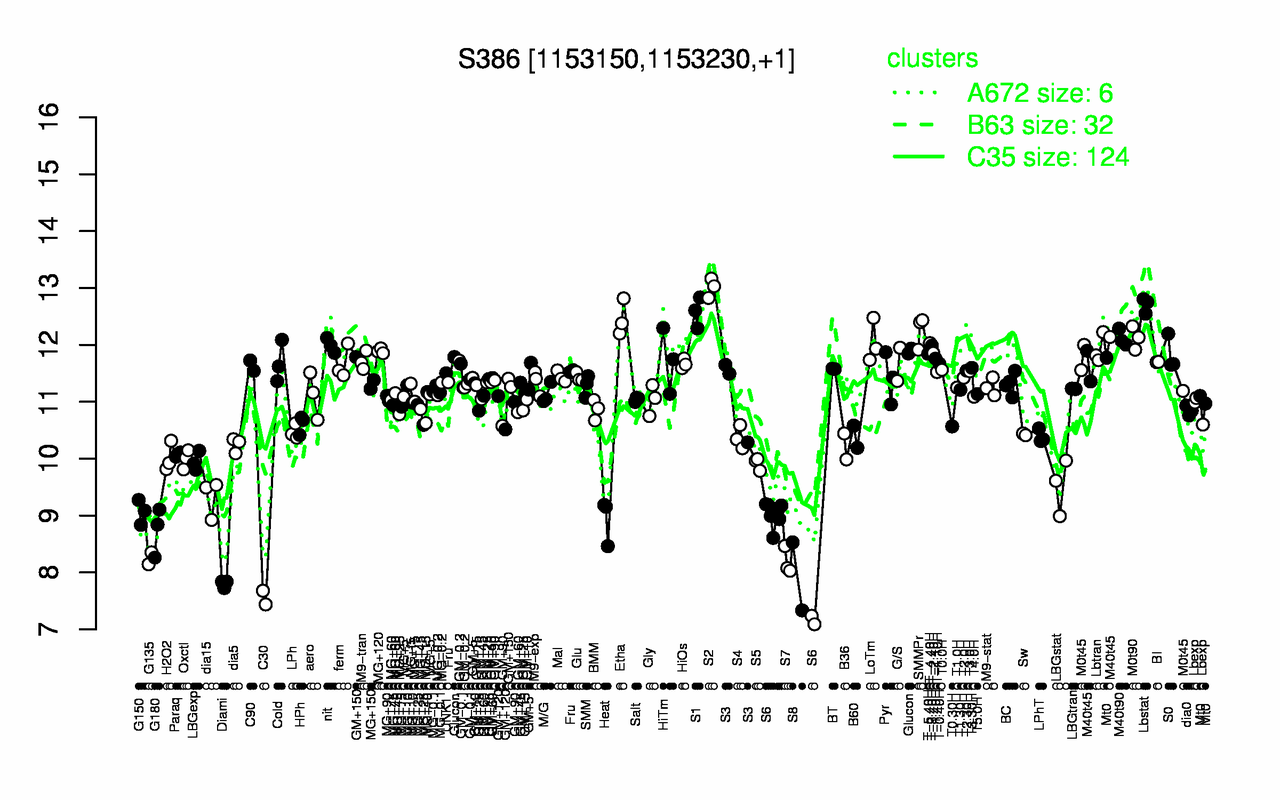
S386
Locus Tag:
new_1153150_1153230
Details about S386
Show/Hide
Highest Expression Conditions
S2
Lbstat
S1
Etha
SMMPr
M0t90
M40t90
LoTm
T-4.40H
nit
13
12.7
12.6
12.5
12.2
12.1
12.1
12
12
12
Lowest Expression Conditions
C30
Diami
S8
S7
G135
S6
G180
Heat
G150
dia15
7.56
7.8
7.93
8.19
8.25
8.61
8.74
8.93
9.07
9.32
Most Positively Correlated Segments
yisK
ykkB
kinA
cwlS
ykkA
yhfC
S748
S824
ypgQ
yokG
0.98
0.84
0.82
0.82
0.82
0.81
0.79
0.78
0.77
0.74
Most Negatively Correlated Segments
S1280
ykoQ
yhcC
yuzE
pbpF
hemZ
S1432
yhbA
yhcB
ywkF
-0.76
-0.76
-0.75
-0.74
-0.73
-0.73
-0.72
-0.72
-0.72
-0.7
Expression Profile of Segment S386
Show/Hide
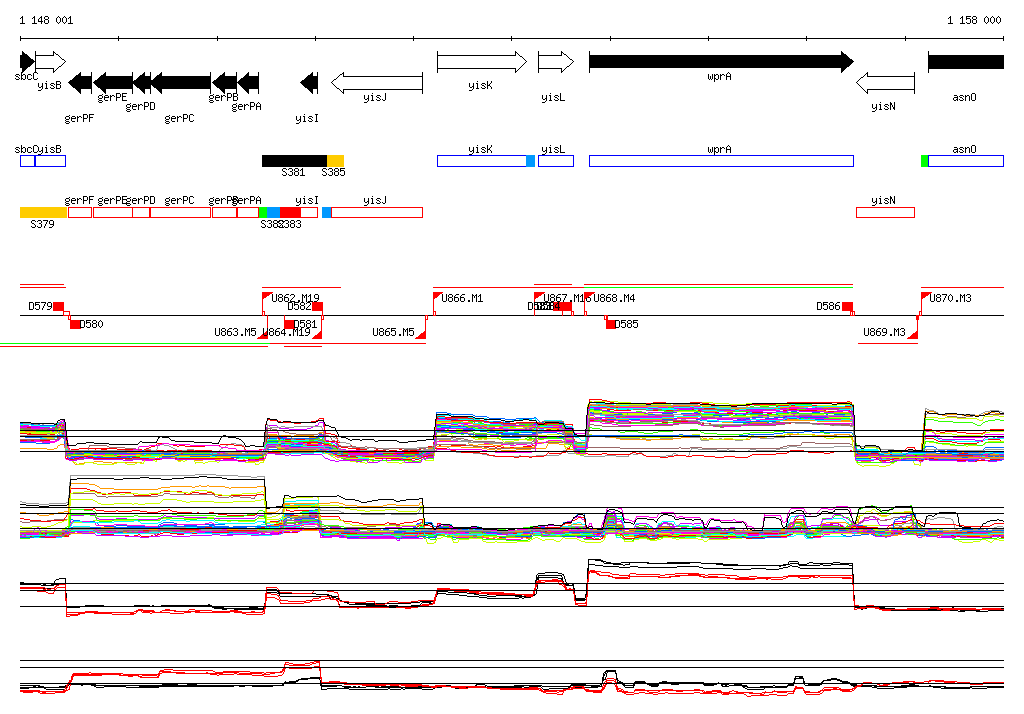
Genomic View of Gene/Segment S386
Show/Hide
(Legend)
Browse Genome Context