| Start Page |
|
 |
| Start Page |
|
|
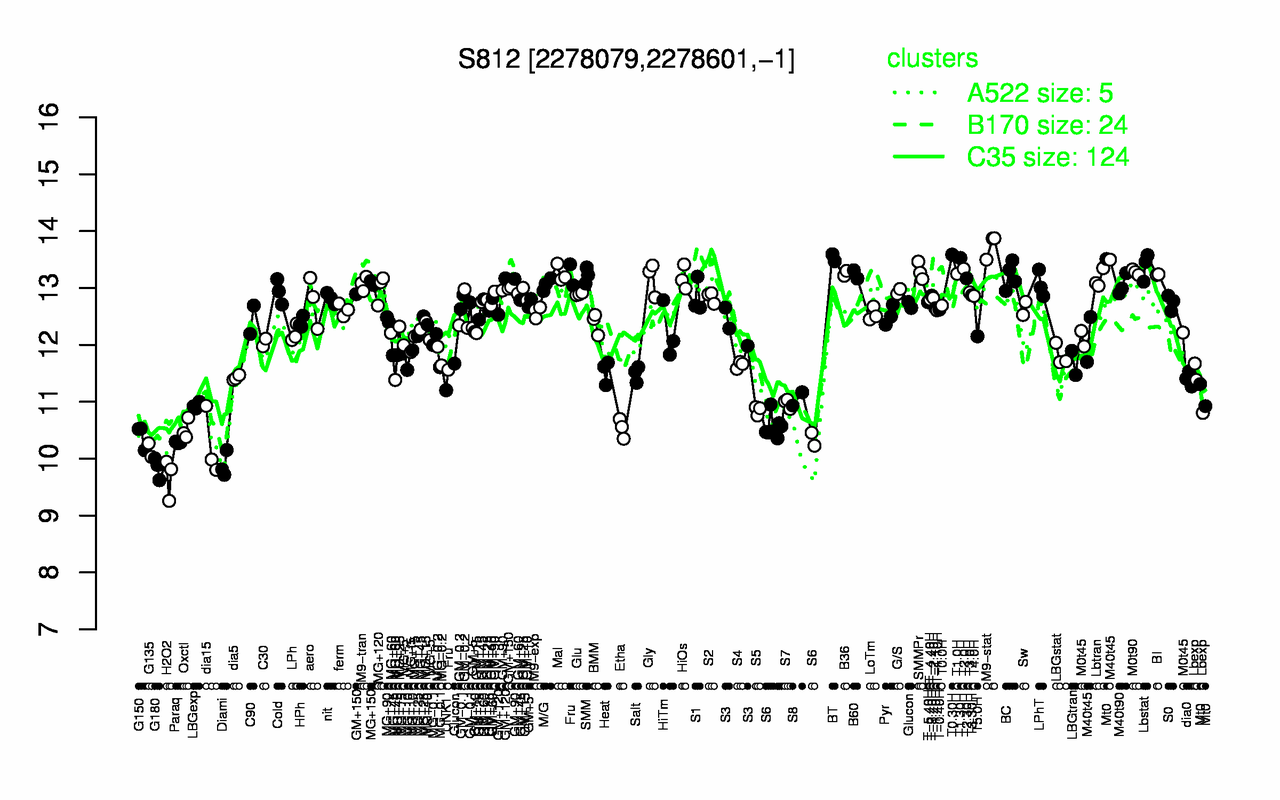
| M9-stat | T0.30H | BT | T1.30H | Lbstat | T2.0H | SMMPr | M0t90 | B36 | Mal |
| 13.7 | 13.6 | 13.5 | 13.5 | 13.4 | 13.3 | 13.3 | 13.3 | 13.3 | 13.3 |
| H2O2 | G180 | Diami | G135 | dia15 | Paraq | G150 | S6 | Oxctl | Etha |
| 9.67 | 9.84 | 9.89 | 10.2 | 10.2 | 10.3 | 10.4 | 10.5 | 10.5 | 10.5 |