| Start Page |
|
 |
| Start Page |
|
|
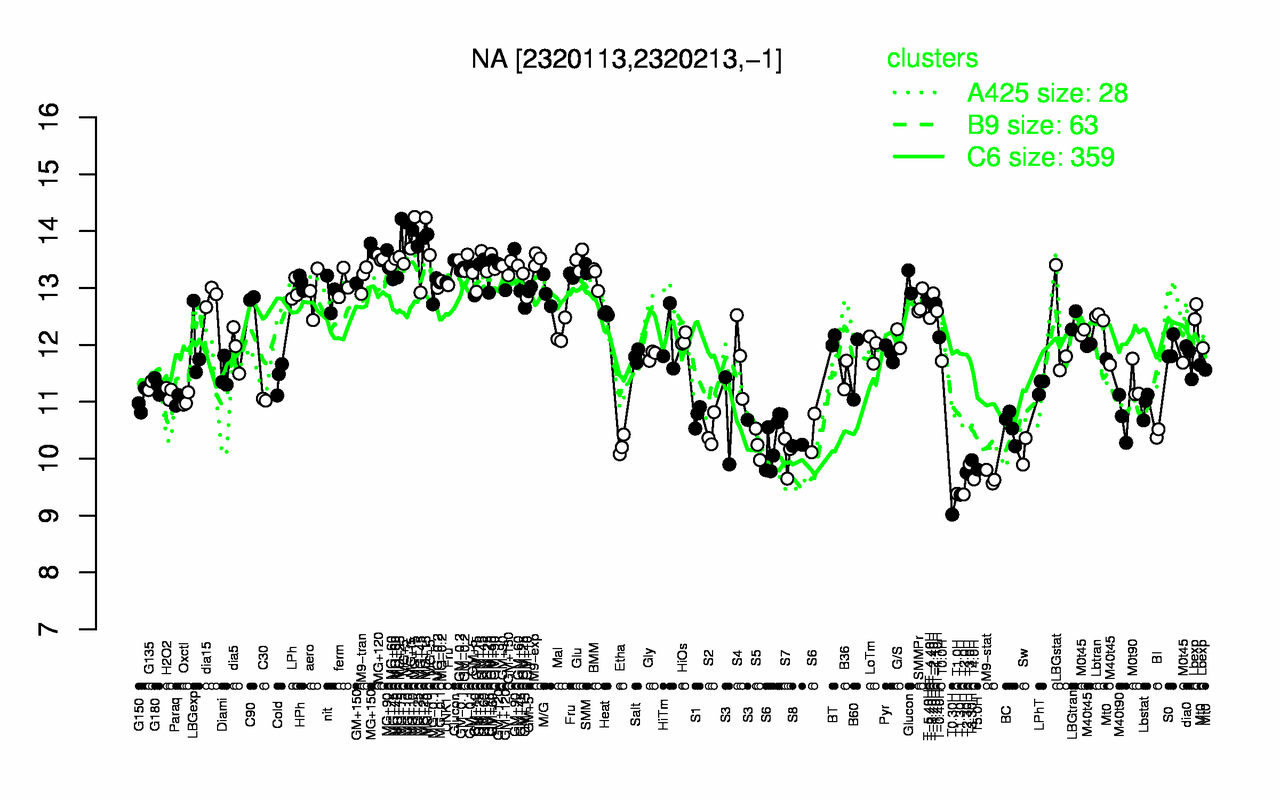
| MG+15 | MG+10 | MG+25 | MG+150 | MG+t5 | MG+120 | MG+90 | M9-exp | MG+5 | Glu |
| 14.2 | 14 | 13.7 | 13.7 | 13.7 | 13.5 | 13.5 | 13.5 | 13.5 | 13.5 |
| T0.30H | T1.30H | T2.0H | T1.0H | T4.0H | M9-stat | T2.30H | T5.0H | T3.0H | T3.30H |
| 9.02 | 9.37 | 9.37 | 9.38 | 9.64 | 9.66 | 9.76 | 9.81 | 9.9 | 9.97 |