| Start Page |
|
 |
| Start Page |
|
|
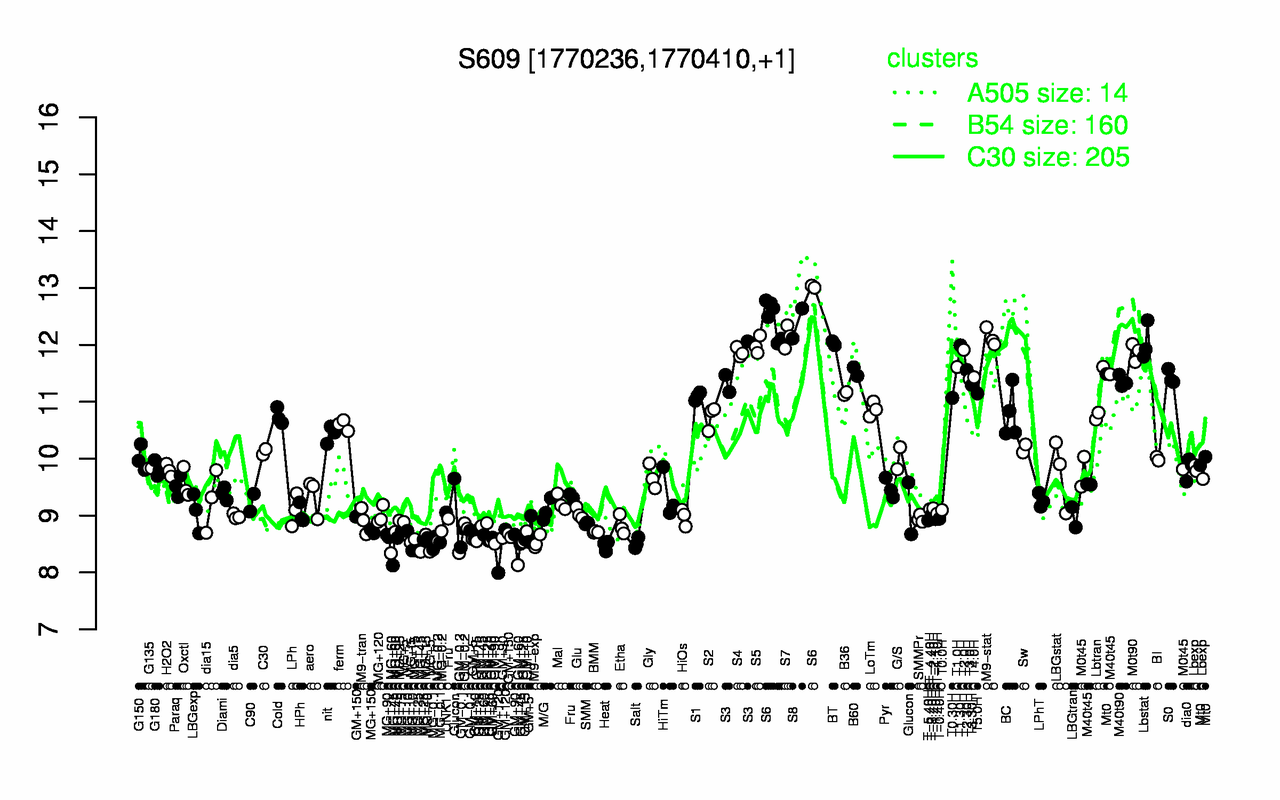
| S6 | S8 | S7 | M9-stat | Lbstat | BT | S5 | T1.30H | T2.0H | M0t90 |
| 12.5 | 12.4 | 12.1 | 12.1 | 12 | 12 | 12 | 12 | 11.9 | 11.9 |
| MG+45 | GM+120 | GM+60 | Heat | Salt | MG-0.1 | MG+60 | MG+t5 | M9-exp | GM+15 |
| 8.36 | 8.37 | 8.47 | 8.47 | 8.51 | 8.52 | 8.52 | 8.53 | 8.54 | 8.56 |