| Start Page |
|
 |
| Start Page |
|
|
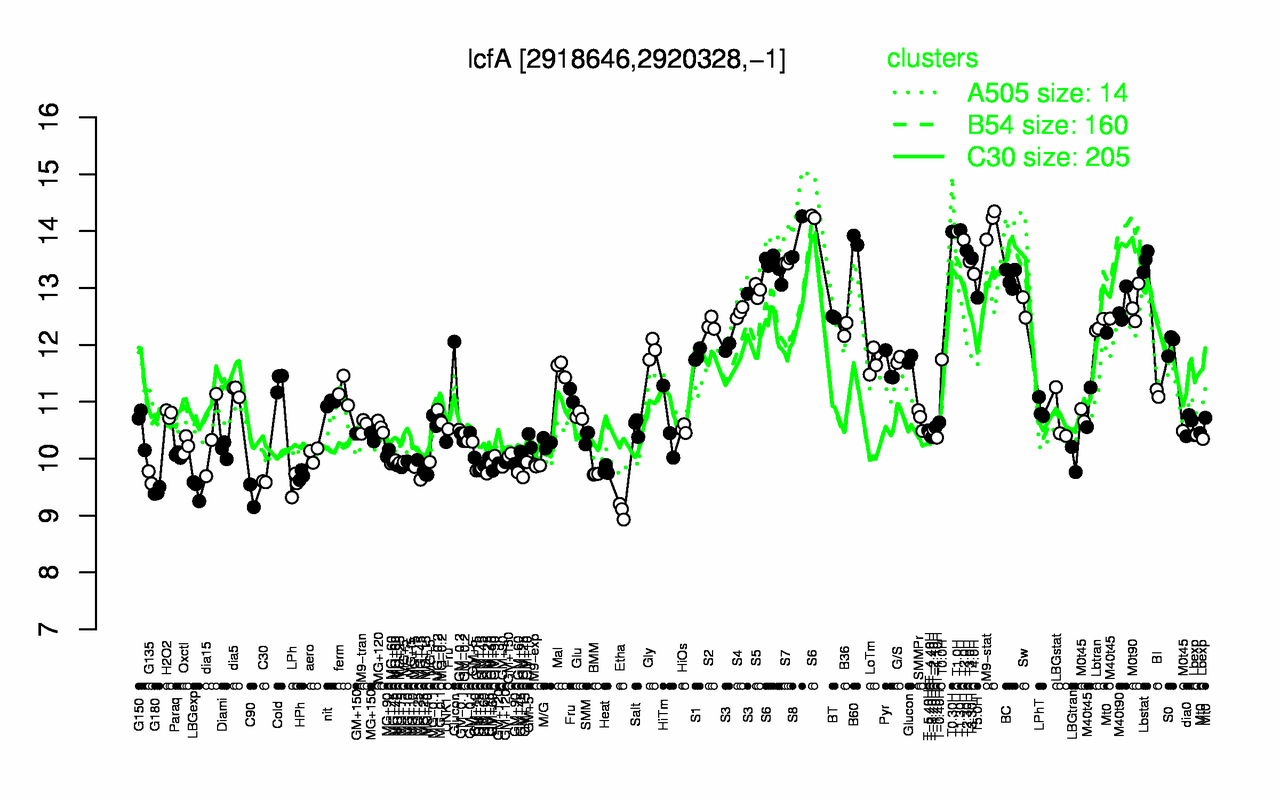
| M9-stat | T1.30H | T1.0H | T0.30H | S8 | T2.0H | B60 | T2.30H | S6 | T3.30H |
| 14.1 | 14 | 14 | 14 | 13.9 | 13.8 | 13.8 | 13.7 | 13.6 | 13.5 |
| Etha | C90 | G180 | LBGexp | LPh | C30 | G135 | HPh | BMM | GM+25 |
| 9.08 | 9.35 | 9.43 | 9.46 | 9.54 | 9.59 | 9.67 | 9.71 | 9.73 | 9.73 |