| Start Page |
|
 |
| Start Page |
|
|
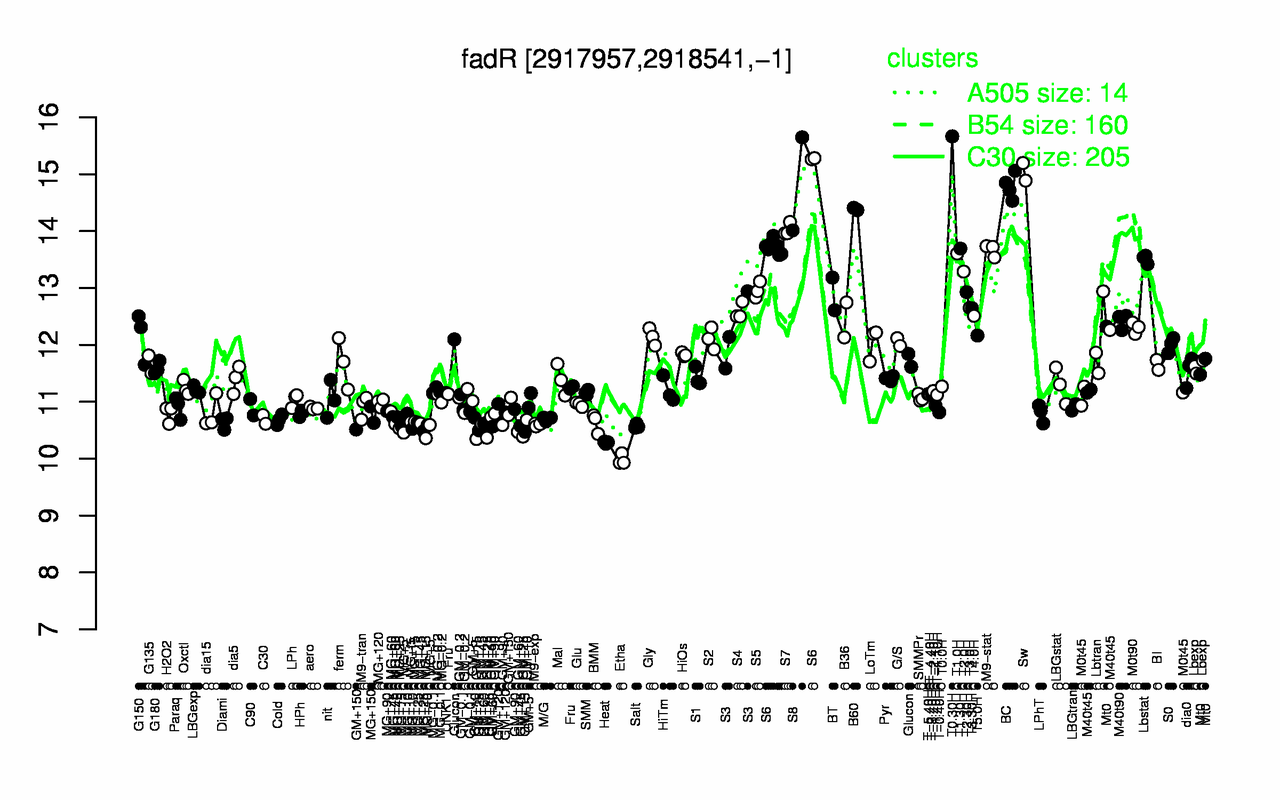
| T0.30H | Sw | S8 | BC | B60 | S6 | S7 | T1.30H | M9-stat | T1.0H |
| 15.7 | 15 | 14.8 | 14.8 | 14.4 | 14.1 | 14 | 13.7 | 13.7 | 13.6 |
| Etha | Heat | GM+25 | GM+15 | MG+5 | MG+15 | GM+60 | MG+25 | Salt | M9-exp |
| 9.98 | 10.3 | 10.4 | 10.5 | 10.5 | 10.5 | 10.6 | 10.6 | 10.6 | 10.6 |